SCAN1 mutant Tdp1 accumulates the enzyme--DNA intermediate and causes camptothecin hypersensitivity
- PMID: 15920477
- PMCID: PMC1150888
- DOI: 10.1038/sj.emboj.7600694
SCAN1 mutant Tdp1 accumulates the enzyme--DNA intermediate and causes camptothecin hypersensitivity
Abstract
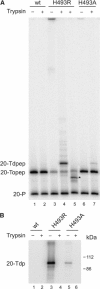
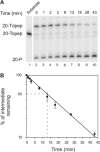
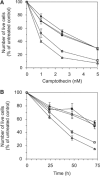
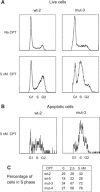
Tyrosyl-DNA phosphodiesterase (Tdp1) catalyzes the hydrolysis of the tyrosyl-3' phosphate linkage found in topoisomerase I-DNA covalent complexes. The inherited disorder, spinocerebellar ataxia with axonal neuropathy (SCAN1), is caused by a H493R mutation in Tdp1. Contrary to earlier proposals that this disease results from a loss-of-function mutation, we show here that this mutation reduces enzyme activity approximately 25-fold and importantly causes the accumulation of the Tdp1-DNA covalent reaction intermediate. Thus, the attempted repair of topoisomerase I-DNA complexes by Tdp1 unexpectedly generates a new protein-DNA complex with an apparent half-life of approximately 13 min that, in addition to the unrepaired topoisomerase I-DNA complex, may interfere with transcription and replication in human cells and contribute to the SCAN1 phenotype. The analysis of Tdp1 mutant cell lines derived from SCAN1 patients reveals that they are hypersensitive to the topoisomerase I-specific anticancer drug camptothecin (CPT), implicating Tdp1 in the repair of CPT-induced topoisomerase I damage in human cells. This finding suggests that inhibitors of Tdp1 could act synergistically with CPT in anticancer therapy.
Figures


Similar articles
-
Spinocerebellar ataxia with axonal neuropathy: consequence of a Tdp1 recessive neomorphic mutation?EMBO J. 2007 Nov 14;26(22):4732-43. doi: 10.1038/sj.emboj.7601885. Epub 2007 Oct 18. EMBO J. 2007. PMID: 17948061 Free PMC article.
-
Hereditary ataxia SCAN1 cells are defective for the repair of transcription-dependent topoisomerase I cleavage complexes.DNA Repair (Amst). 2006 Dec 9;5(12):1489-94. doi: 10.1016/j.dnarep.2006.07.004. Epub 2006 Aug 28. DNA Repair (Amst). 2006. PMID: 16935573
-
Identification of novel inhibitors for the tyrosyl-DNA-phosphodiesterase 1 (Tdp1) mutant SCAN1 using virtual screening.Bioorg Med Chem. 2020 Jan 1;28(1):115234. doi: 10.1016/j.bmc.2019.115234. Epub 2019 Nov 30. Bioorg Med Chem. 2020. PMID: 31831297
-
Tyrosyl-DNA phosphodiesterase as a target for anticancer therapy.Anticancer Agents Med Chem. 2008 May;8(4):381-9. doi: 10.2174/187152008784220357. Anticancer Agents Med Chem. 2008. PMID: 18473723 Free PMC article. Review.
-
Spinocerebellar ataxia with axonal neuropathy.Adv Exp Med Biol. 2010;685:75-83. doi: 10.1007/978-1-4419-6448-9_7. Adv Exp Med Biol. 2010. PMID: 20687496 Review.
Cited by
-
Umbelliferone and Its Synthetic Derivatives as Suitable Molecules for the Development of Agents with Biological Activities: A Review of Their Pharmacological and Therapeutic Potential.Pharmaceuticals (Basel). 2023 Dec 15;16(12):1732. doi: 10.3390/ph16121732. Pharmaceuticals (Basel). 2023. PMID: 38139858 Free PMC article. Review.
-
Processing of damaged DNA ends for double-strand break repair in mammalian cells.ISRN Mol Biol. 2012;2012:345805. doi: 10.5402/2012/345805. ISRN Mol Biol. 2012. PMID: 24236237 Free PMC article.
-
Natural Products and Their Derivatives as Inhibitors of the DNA Repair Enzyme Tyrosyl-DNA Phosphodiesterase 1.Int J Mol Sci. 2023 Mar 17;24(6):5781. doi: 10.3390/ijms24065781. Int J Mol Sci. 2023. PMID: 36982848 Free PMC article. Review.
-
Balancing repair and tolerance of DNA damage caused by alkylating agents.Nat Rev Cancer. 2012 Jan 12;12(2):104-20. doi: 10.1038/nrc3185. Nat Rev Cancer. 2012. PMID: 22237395 Free PMC article. Review.
-
Repair of topoisomerase I-mediated DNA damage.Prog Nucleic Acid Res Mol Biol. 2006;81:179-229. doi: 10.1016/S0079-6603(06)81005-6. Prog Nucleic Acid Res Mol Biol. 2006. PMID: 16891172 Free PMC article. Review.
References
-
- Barthelmes HU, Habermeyer M, Christensen MO, Mielke C, Interthal H, Pouliot JJ, Boege F, Marko D (2004) TDP1 overexpression in human cells counteracts DNA damage mediated by topoisomerases I and II. J Biol Chem 279: 55618–55625 - PubMed
-
- Caldecott KW (2003) DNA single-strand break repair and spinocerebellar ataxia. Cell 112: 7–10 - PubMed
-
- Caldecott KW (2004) DNA single-strand breaks and neurodegeneration. DNA Repair (Amst) 3: 875–882 - PubMed
-
- Champoux JJ (2001) DNA topoisomerases: structure, function, and mechanism. Annu Rev Biochem 70: 369–413 - PubMed
Publication types
MeSH terms
Substances
Grants and funding
LinkOut - more resources
Full Text Sources
Molecular Biology Databases

