. 2005 Jun 15;24(12):2053-63.
doi: 10.1038/sj.emboj.7600682. Epub 2005 May 26.

Movements of the epsilon-subunit during catalysis and activation in single membrane-bound H(+)-ATP synthase

Affiliations

Movements of the epsilon-subunit during catalysis and activation in single membrane-bound H(+)-ATP synthase

Boris Zimmermann et al. EMBO J. .

Abstract

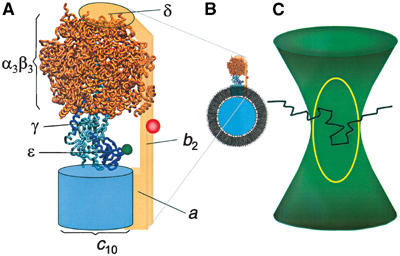
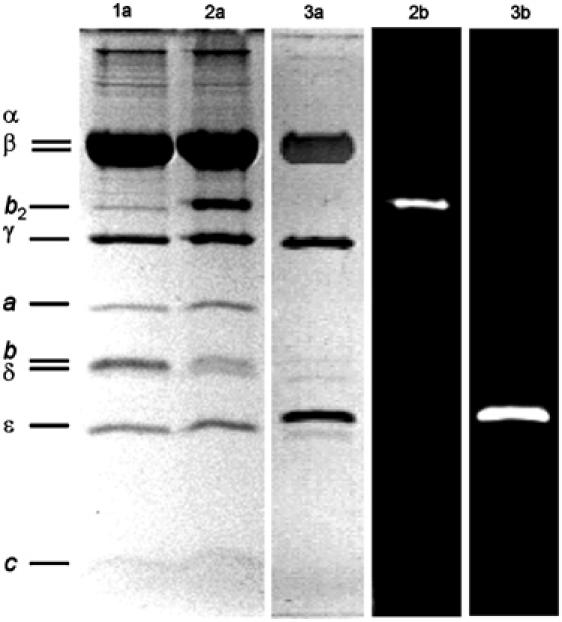
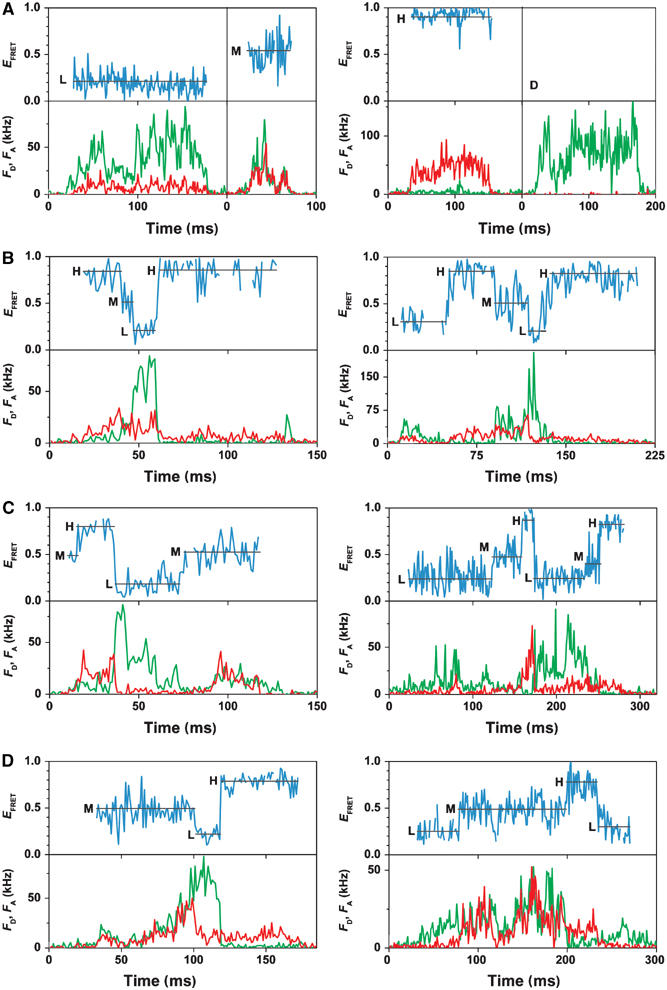
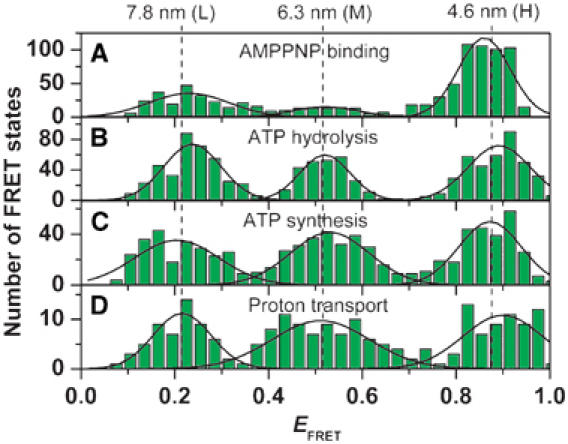
F0F1-ATP synthases catalyze proton transport-coupled ATP synthesis in bacteria, chloroplasts, and mitochondria. In these complexes, the epsilon-subunit is involved in the catalytic reaction and the activation of the enzyme. Fluorescence-labeled F0F1 from Escherichia coli was incorporated into liposomes. Single-molecule fluorescence resonance energy transfer (FRET) revealed that the epsilon-subunit rotates stepwise showing three distinct distances to the b-subunits in the peripheral stalk. Rotation occurred in opposite directions during ATP synthesis and hydrolysis. Analysis of the dwell times of each FRET state revealed different reactivities of the three catalytic sites that depended on the relative orientation of epsilon during rotation. Proton transport through the enzyme in the absence of nucleotides led to conformational changes of epsilon. When the enzyme was inactive (i.e. in the absence of substrates or without membrane energization), three distances were found again, which differed from those of the active enzyme. The three states of the inactive enzyme were unequally populated. We conclude that the active-inactive transition was associated with a conformational change of epsilon within the central stalk.


Figures

Figure 1
Figure 1
Model of the H+-ATP synthase from E. coli as derived from electron microscopic data (Böttcher et al, 2000; Rubinstein et al, 2003), the homology model of F1 (Engelbrecht and Junge, 1997), and the structure of the γɛ-complex (Rodgers and Wilce, 2000). (A) The H+-ATP synthase is labeled with the FRET donor TMR (green) at the ɛ-subunit and the FRET acceptor Cy5bis (red) at the b-subunits. ‘Rotor' subunits are depicted in blue and ‘stator' subunits are orange. (B) F0F1 incorporated into a liposome membrane. The diameter of the F1 part is 10 nm and that of the liposome is 120 nm. Liposomes used for FRET analysis contained one F0F1. (C) Photon bursts from the FRET-labeled F0F1 are observed when the liposome traverses the confocal detection volume (yellow line) within the excitation focus (green) of the laser. A schematic diffusion pathway of the liposome through the confocal volume is indicated (black line).
Figure 2
Figure 2
SDS–PAGE (13%) of F1 and F0F1. Lanes marked with (a) show the protein stained with Coomassie blue and those marked with (b) show the corresponding fluorograms. Lane 1: F0-bQ64C-F1; lane 2: F0-bQ64C-Cy5bis-F1 showing crosslinking of subunits b by Cy5bis; lane 3: F1-ɛH56C-TMR.
Figure 3
Figure 3
Photon bursts of FRET-labeled F0F1 in liposomes. Corrected fluorescence intensity traces of the donor, FD, and acceptor, FA, are green and red, respectively. The FRET efficiencies (EFRET) calculated from these traces are shown as blue traces. For each FRET level, the arithmetic mean value is calculated (black line). The three FRET states are labeled L, M, and H. (A) Traces in the presence of AMPPNP showing constant FRET efficiencies and a donor-only-labeled F0F1 in a liposome (D). (B) Traces during ATP hydrolysis showing stepwise changes of FRET levels in the sequence → L → H → M → L. (C) Traces during ATP synthesis showing stepwise changes of FRET levels in the sequence → L → M → H → L. (D) Traces during proton transport showing both sequences.
Figure 4
Figure 4
Histograms of the FRET efficiencies for the active F0F1. The mean FRET efficiency was calculated for each observed FRET level (see black lines in Figure 3) and the number of observations was plotted as a function of EFRET. (A) In the presence of AMPPNP (data from 888 photon bursts). (B) ATP hydrolysis (454 photon bursts). (C) ATP synthesis (368 photon bursts). (D) proton transport (140 photon bursts). The peaks were fitted by Gaussian distributions. For all conditions, the maxima of the distributions are observed at the same FRET efficiency (black lines). The calculated distances are shown at the top.
Figure 5
Figure 5
Histograms of dwell times of all FRET levels (A) during ATP hydrolysis (292 dwells) and (B) during ATP synthesis (193 dwells). Monoexponential fits (black lines) yield average dwell times of tH=14.3±0.7 ms (mean±standard deviation of the mean) during ATP hydrolysis and tS=17.7±0.9 ms during ATP synthesis. Monoexponential fits of the dwell times of each FRET level separately (see insets) give t=17.6±1.4 ms (L, 89 dwells), t=12.7±1.0 ms (M, 139 dwells), and t=15.8±1.7 ms (H, 64 dwells) for ATP hydrolysis, and t=24.0±4.4 ms (L, 41 dwells), t=15.4±1.0 ms (M, 108 dwells), and t=19.5±2.2 ms (H, 44 dwells) for ATP synthesis.
Figure 6
Figure 6
Histograms of the FRET efficiencies for the inactive F0F1. The mean FRET efficiency was calculated for each observed FRET state and the number of observations was plotted as a function of EFRET. For all conditions, the FRET state remained constant during the burst (see Figure 3A). (A) In the presence of AMPPNP (same data as in Figure 4). (B) Buffer, pH 8 (761 photon bursts). (C) Buffer, pH 8, in the presence of ADP (1428 photon bursts). (D) Buffer, pH 8, in the presence of phosphate (869 photon bursts). (E) Buffer, pH 8, in the presence of ADP and phosphate (960 photon bursts). (F) Buffer, pH 4.7, in the presence of ADP and phosphate (985 photon bursts). (G) 5 min after ATP synthesis (755 photon bursts). (H) 5 min after energization with ΔpH and Δφ (230 photon bursts). The peaks were fitted by Gaussian distributions. For all conditions, the same maxima of the distributions are observed (black lines) except for AMPPNP. The calculated distances are shown at the top.
Figure 7
Figure 7
Visualization of the FRET distances in the F0F1 model. (A) The three donor–acceptor distances calculated from the FRET efficiencies obtained during catalysis are shown in green and labeled H, M, and L. The ATP synthesis direction is shown by an yellow arrow and ATP hydrolysis direction by a blue arrow. (B–D) The three donor–acceptor distances calculated from the FRET efficiencies of the inactive enzyme are shown in orange and labeled H*, M*, and L*, in addition to the active positions in green. The different active–inactive distance changes in the H-, M-, and L-state by the same conformational change in the γɛ-complex. (B) Distance changes by expanding the radius of rotation at ɛ56. (C) Distance change by shifting perpendicular to the membrane plane. (D) Distance changes by tilting with respect to the membrane plane.

Similar articles

Cited by

References

    1. Aggeler R, Capaldi RA (1992) Cross-linking of the γ subunit of the Escherichia coli ATPase (ECF1) via cysteines introduced by site-directed mutagenesis. J Biol Chem 267: 21355–21359 - PubMed
    1. Aggeler R, Ogilvie I, Capaldi RA (1997) Rotation of a γ–ɛ subunit domain in the Escherichia coli F1F0-ATP synthase complex. The γ–ɛ subunits are essentially randomly distributed relative to the α3β3δ domain in the intact complex. J Biol Chem 272: 19621–19624 - PubMed
    1. Boldt F-M, Heinze J, Diez M, Petersen J, Börsch M (2004) Real-time pH microscopy down to the molecular level by combined scanning electrochemical microscopy/single molecule fluorescence spectroscopy. Anal Chem 76: 3473–3481 - PubMed
    1. Börsch M, Diez M, Zimmermann B, Reuter R, Gräber P (2002) Stepwise rotation of the γ-subunit of EF0F1-ATP synthase observed by intramolecular single-molecule fluorescence resonance energy transfer. FEBS Lett 527: 147–152 - PubMed
    1. Börsch M, Turina P, Eggeling C, Fries JR, Seidel CA, Labahn A, Gräber P (1998) Conformational changes of the H+-ATPase from Escherichia coli upon nucleotide binding detected by single molecule fluorescence. FEBS Lett 437: 251–254 - PubMed

Publication types

MeSH terms

Substances