. 2005 Aug;89(2):951-66.
doi: 10.1529/biophysj.105.060533. Epub 2005 May 27.

Signaling through receptors and scaffolds: independent interactions reduce combinatorial complexity

Affiliations

Signaling through receptors and scaffolds: independent interactions reduce combinatorial complexity

Nikolay M Borisov et al. Biophys J. 2005 Aug.

Abstract

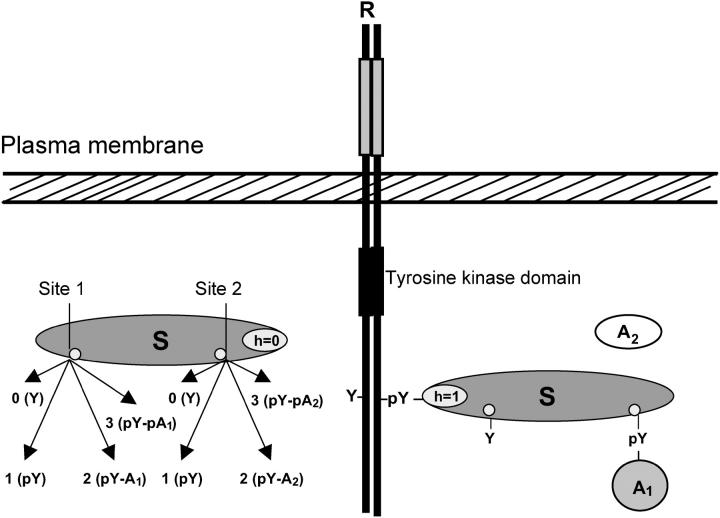
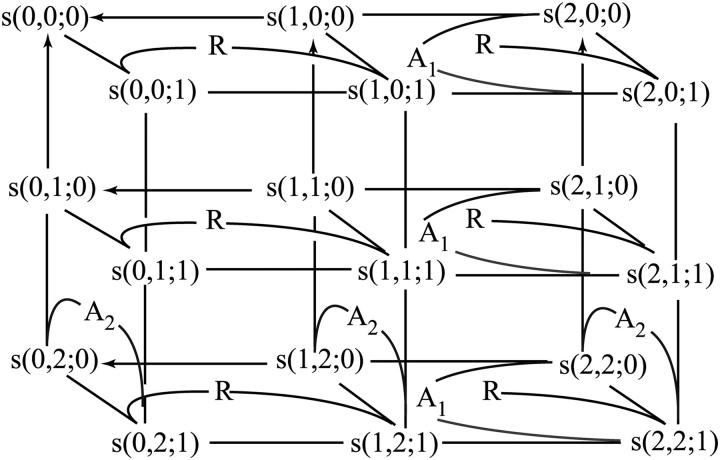
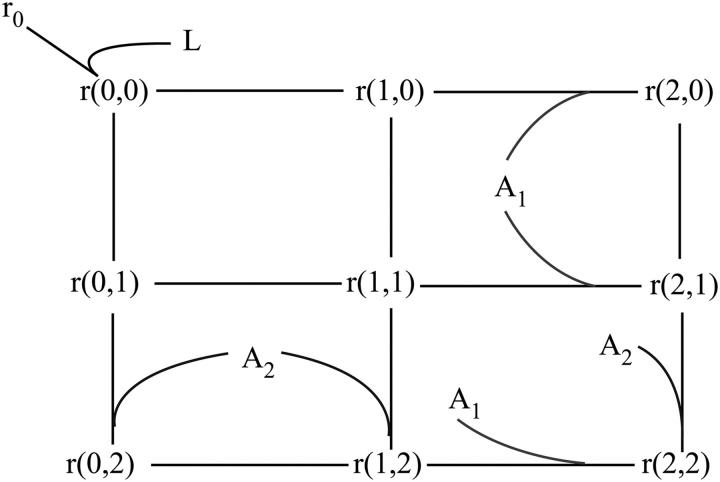
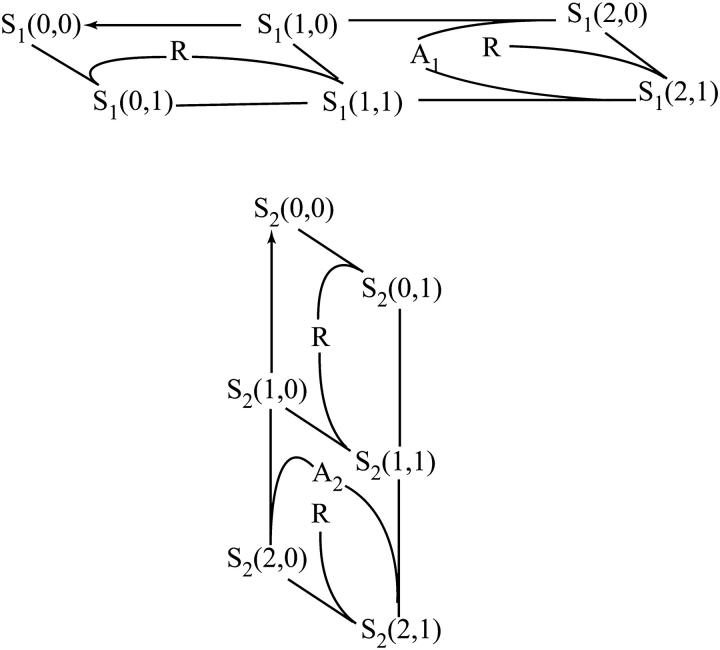
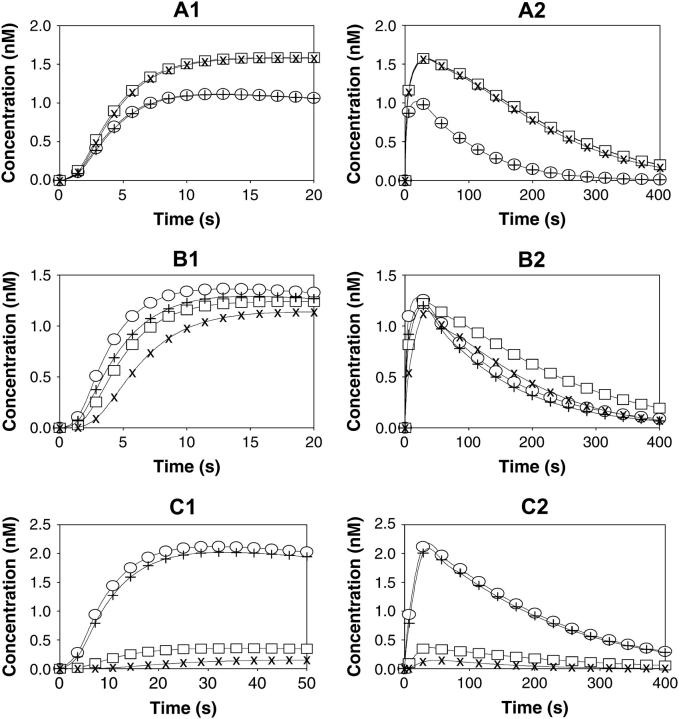
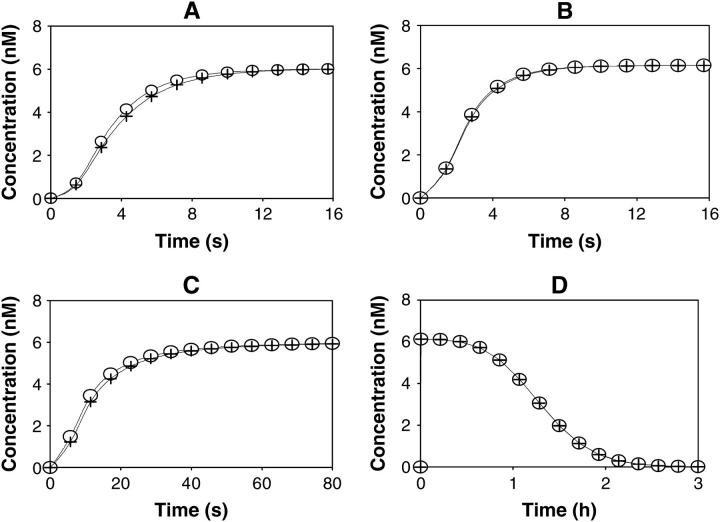
After activation, many receptors and their adaptor proteins act as scaffolds displaying numerous docking sites and engaging multiple targets. The consequent assemblage of a variety of protein complexes results in a combinatorial increase in the number of feasible molecular species presenting different states of a receptor-scaffold signaling module. Tens of thousands of such microstates emerge even for the initial signal propagation events, greatly impeding a quantitative analysis of networks. Here, we demonstrate that the assumption of independence of molecular events occurring at distinct sites enables us to approximate a mechanistic picture of all possible microstates by a macrodescription of states of separate domains, i.e., macrostates that correspond to experimentally verifiable variables. This analysis dissects a highly branched network into interacting pathways originated by protein complexes assembled on different sites of receptors and scaffolds. We specify when the temporal dynamics of any given microstate can be expressed using the product of the relative concentrations of individual sites. The methods presented here are equally applicable to deterministic and stochastic calculations of the temporal dynamics. Our domain-oriented approach drastically reduces the number of states, processes, and kinetic parameters to be considered for quantification of complex signaling networks that propagate distinct physiological responses.


Figures

FIGURE 1
FIGURE 1
A digital flag description of domain states of a scaffolding protein. The scaffolding adaptor protein S binds to the receptor R via a specific domain (h). For the unbound S, h = 0, and when S is bound to R, h = 1. Two docking sites on S display a variety of states: 0 indicates free unphosphorylated site (shown as a tyrosine residue Y); 1 denotes free phosphorylated site (pY); 2 represents a site occupied by a binding partner (pY-A); and 3 stands for phosphorylation of this partner (pY-pA).
FIGURE 2
FIGURE 2
Fragment of a transition graph for a scaffolding protein with two docking sites. Species s(0,0;0), s(1,0;0), and s(2,0;0) correspond to the scaffold that is not bound to the receptor R (h = 0), unphosphorylated on docking site 2 and has docking site 1 unphosphorylated, phosphorylated, or occupied by a binding partner (A1), respectively. Species s(0,1;0), s(1,1;0), s(2,1;0) and s(0,2;0), s(1,2;0), and s(2,2;0) differ from the species above only by the state of docking site 2, which is phosphorylated (the first three) or occupied by a binding partner A2 (the last three). The terms s(i,j;1) (i,j = 0, 1, 2) are the complexes of the scaffold species s(i,j;0) with R. Reversible reactions and transitions that can occur in both directions, such as the molecule binding/dissociation, phosphorylation by the receptor kinase, and dephosphorylation by a phosphatase, are shown by lines. Arrows indicate irreversible dephosphorylation steps, which do not have phosphorylation transitions in the opposite direction, as for the scaffold that has dissociated from the receptor.
FIGURE 3
FIGURE 3
Fragment of a transition graph for a receptor with two docking sites for downstream interacting proteins. L, ligand; r0, free receptor; and r(0,0), ligand-receptor complex with two unphosphorylated docking sites. For all species in the network, r(i,j), i = 0, 1, or 2 indicates that the first docking site on the receptor is unphosphorylated, phosphorylated, or occupied by adaptor protein A1, respectively, and j = 0, 1, or 2 means that the second receptor docking site is unphosphorylated, phosphorylated, or occupied by adaptor protein A2. Note that phosphorylation of the receptor even on a single site locks the ligand in place.
FIGURE 4
FIGURE 4
Macrodescription of the transition graph shown in Fig. 2. Macrovariables, S1 and S2, correspond to states of docking sites 1 and 2, respectively, and are expressed in terms of microstates of Fig. 2 as follows. The upper panel: S1(0,0) = s(0,0;0) + s(0,1;0) + s(0,2;0); S1(1,0) = s(1,0;0) + s(1,1;0) + s(1,2;0); S1(2,0) = s(2,0;0) + s(2,1;0) + s(2,2;0); S1(0,1) = s(0,0;1) + s(0,1;1) + s(0,2;1), S1(1,1) = s(1,0;1) + s(1,1;1) + s(1,2;1); S1(2,1) = s(2,0;1) + s(2,1;1) + s(2,2;1). Summation goes along vertical edges of rear and front facets of the graph in Fig. 2. The lower panel: S2(0,0) = s(0,0;0) + s(1,0;0) + s(2,0;0); S2(1,0) = s(0,1;0) + s(1,1;0) + s(2,1;0); S2(2,0) = s(0,2;0) + s(1,2;0) + s(2,2;0); S2(0,1) = s(0,0;1) + s(1,0;1) + s(2,0;1); S2(1,1) = s(0,1;1) + s(1,1;1) + s(2,1;1); S2(2,1) = s(0,2;1) + s(1,2;1) + s(2,2;1). Summation goes along horizontal edges of the rear and front facets of the graph in Fig. 2. Arrows indicate one-directional transitions.
FIGURE 5
FIGURE 5
Time-course of receptor-bound and unbound scaffold forms with docking sites occupied by their partners A1 and A2. AC illustrate three cases, where the scaffold-receptor association/dissociation reactions are much faster, comparable, or slower than the reactions involving scaffold docking sites. The left and right panels (marked by numbers 1 and 2) present the short and extended time windows. Exact concentrations are calculated according to Eq. 1 (microdescription) and marked with ○ and □ for scaffold forms bound and unbound to the receptor, i.e., s(2,2;1) and s(2,2;0), respectively. The approximate concentrations of microstates are obtained by solving Eq. 4 using Eq. 9 and marked with + and × for forms bound and unbound to the receptor, respectively. The rate constants are the following (see Fig. 2): kr = 0.05 nM−1 · s−1, 5 · 10−3 nM−1 · s−1 and 5 · 10−4 nM−1 · s−1 and k−r = 5 s−1, 0.5 s−1, and 0.05 s−1 for AC, respectively (Kd = 100 nM for all cases); k1(0→1;1) = 0.2 s−1, k1(0→1;0) = 0, k1(1→0;1) = k1(1→0;0) = 0.8 s−1, k1(1→2;1) = k1(1→2;0) = 0.02 nM−1 · s−1, k1(2→1;1) = k1(2→1;0) = 0.8 s−1; k2(0→1;1) = 0.8 s−1, k2(0→1;0) = 0, k2(1→0;1) = k2(1→0;0) = 0.2 s−1, k2(1→2;1) = k2(1→2;0) = 0.02 nM−1 · s−1, k2(2→1;1) = k2(2→1;0) = 0.2 s−1; R = R0 · exp(−kdeac · t), R0 = 100 nM, kdeac = 0.01 s−1; Stot = (A1)tot = (A2)tot = 50 nM. The initial conditions for Eq. 1 and 4 were set as follows: s(0,0;0) = 50 nM, s(0,0;1) = 1 · 10−10 nM, whereas all other s(a1,a2;h) = 0; S1(0,0) = S2(0,0) = 50 nM, S1(0,1) = S2(0,1) = 1 · 10−10 nM, and all other Si(ai,h) = 0. The freely available Jarnac software package was used for simulations (56).
FIGURE 6
FIGURE 6
Time-course of the receptor forms with docking sites occupied by adaptor proteins A1 and A2. A and B illustrate cases of fast receptor-ligand binding/dissociation with low and high affinity, respectively. C corresponds to slow receptor-ligand binding/dissociation with low affinity. The total ligand concentration (Ltot) is assumed constant (AC). D illustrates the case of an exponential decrease of the free ligand concentration (L). Exact values of the microstate concentration r(2,2) are calculated according to Eq. 2 (microdescription) and marked with ○. Approximate values are determined by solving Eq. 14 and using Eq. 15 and marked with +. The rate constants for the model are the following: k0 = 0.05 nM−1 · s−1, 1.667 nM−1 · s−1, 5 · 10−4 nM−1 · s−1, and 5 · 10−3 nM−1 · s−1 for AD, respectively; k−0 = 5 s−1, 5 s−1, 0.05 s−1, and 0.5 s−1 for AD, respectively; Kd = 100 nM for AD and 3 nM for B; k1(0→1;1) = 0.2 s−1, k1(0→1;0) = 0, k1(1→0;1) = k1(1→0;0) = 0.8 s−1, k1(1→2;1) = k1(1→2;0) = 0.02 nM−1 · s−1, k1(2→1;1) = k1(2→1;0) = 0.8 s−1; k2(0→1;1) = 0.8 s−1, k2(0→1;0) = 0, k2(1→0;1) = k2(1→0;0) = 0.2 s−1, k2(1→2;1) = k2(1→2;0) = 0.02 nM−1 · s−1, k2(2→1;1) = k2(2→1;0) = 0.2 s−1; total abundances Rtot = 100 nM; (A1)tot = (A2)tot = 50 nM; Ltot = 100 nM for AC, L = L0 · exp(−kdeg · t), L0 = 100 nM, kdeg = 1 · 10−3 s−1 for D. The initial conditions for Eqs. 2 and 18 were set as follows: r0 = 100 nM, r(0,0) = 1 · 10−10 nM, whereas all other r(a1,a2) = 0; formula image = 100 nM, formula image(0) = formula image(0) = 1 · 10−10 nM, and all other formula image(ai) = 0.

References

    1. Hunter, T. 2000. Signaling—2000 and beyond. Cell. 100:113–127. - PubMed
    1. Schlessinger, J. 2000. Cell signaling by receptor tyrosine kinases. Cell. 103:211–225. - PubMed
    1. Pawson, T., G. D. Gish, and P. Nash. 2001. SH2 domains, interaction modules and cellular wiring. Trends Cell Biol. 11:504–511. - PubMed
    1. White, M. F. 2002. IRS proteins and the common path to diabetes. Am. J. Physiol. Endocrinol. Metab. 283:E413–E422. - PubMed
    1. Liu, P., P. Wang, P. Michaely, M. Zhu, and R. G. Anderson. 2000. Presence of oxidized cholesterol in caveolae uncouples active platelet-derived growth factor receptors from tyrosine kinase substrates. J. Biol. Chem. 275:31648–31654. - PubMed

Publication types

Substances

LinkOut - more resources