. 2005 Aug;89(2):1398-410.
doi: 10.1529/biophysj.104.055640. Epub 2005 May 27.

Ras diffusion is sensitive to plasma membrane viscosity

Affiliations

Ras diffusion is sensitive to plasma membrane viscosity

J Shawn Goodwin et al. Biophys J. 2005 Aug.

Abstract

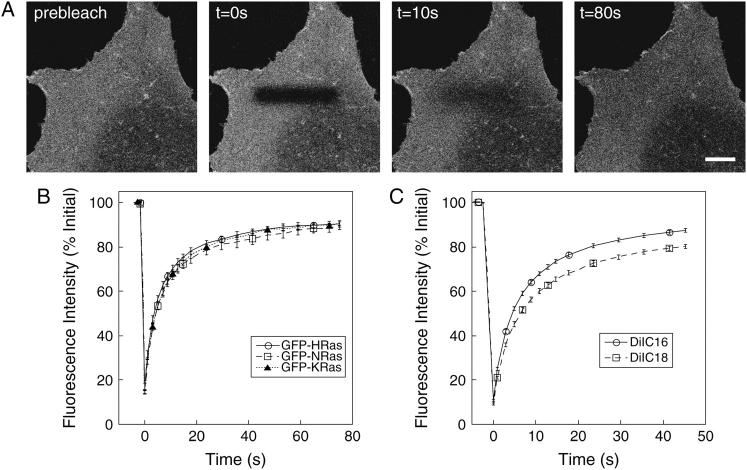
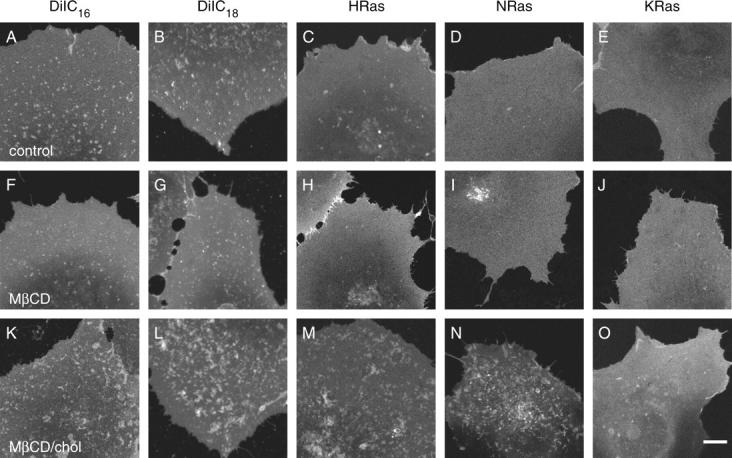
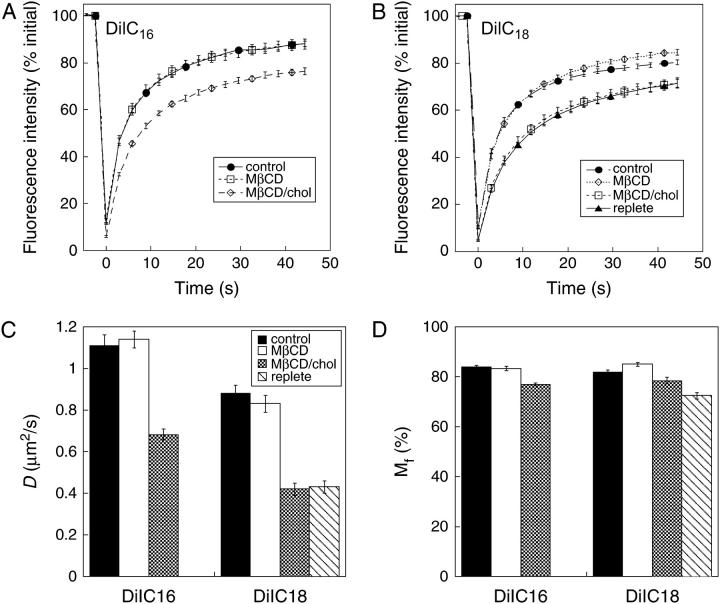
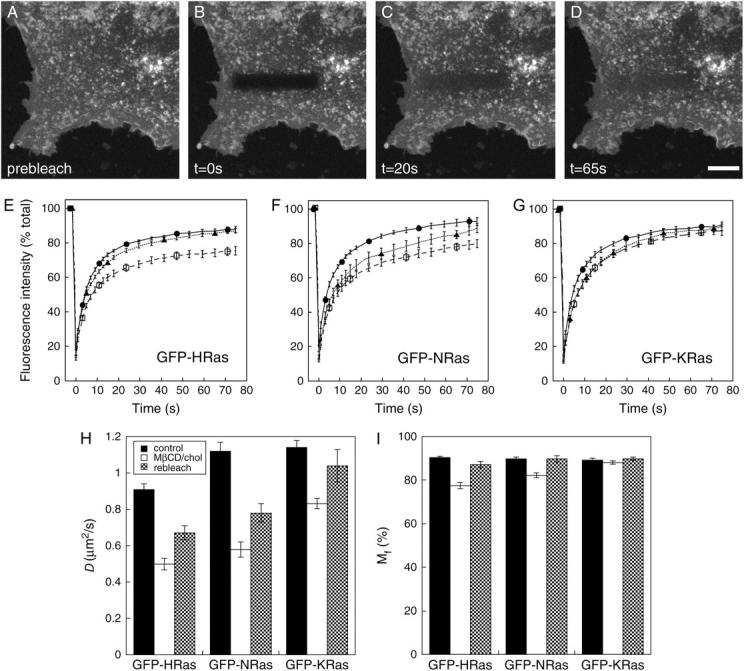
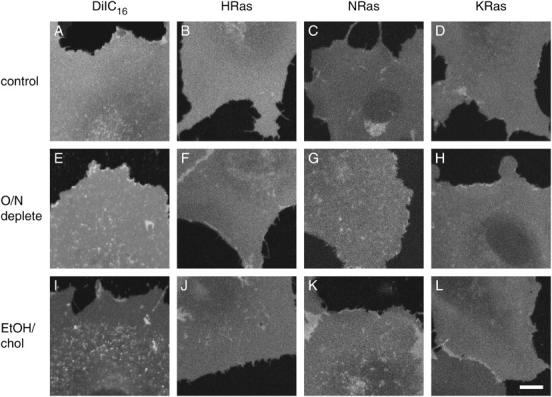
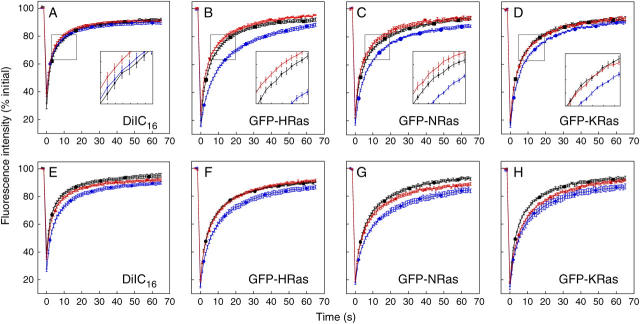
The cell surface contains a variety of barriers and obstacles that slow the lateral diffusion of glycosylphosphatidylinositol (GPI)-anchored and transmembrane proteins below the theoretical limit imposed by membrane viscosity. How the diffusion of proteins residing exclusively on the inner leaflet of the plasma membrane is regulated has been largely unexplored. We show here that the diffusion of the small GTPase Ras is sensitive to the viscosity of the plasma membrane. Using confocal fluorescence recovery after photobleaching, we examined the diffusion of green fluorescent protein (GFP)-tagged HRas, NRas, and KRas in COS-7 cells loaded with or depleted of cholesterol, a well-known modulator of membrane bilayer viscosity. In cells loaded with excess cholesterol, the diffusional mobilities of GFP-HRas, GFP-NRas, and GFP-KRas were significantly reduced, paralleling the behavior of the viscosity-sensitive lipid probes DiIC(16) and DiIC(18). However, the effects of cholesterol depletion on protein and lipid diffusion in cell membranes were highly dependent on the depletion method used. Cholesterol depletion with methyl-beta-cyclodextrin slowed Ras diffusion by a viscosity-independent mechanism, whereas overnight cholesterol depletion slightly increased both protein and lipid diffusion. The ability of Ras to sense membrane viscosity may represent a general feature of proteins residing on the cytoplasmic face of the plasma membrane.


Figures

FIGURE 1
FIGURE 1
Diffusional mobilities of GFP-HRas, GFP-NRas, and GFP-KRas are similar to one another and the fluorescent lipid probes DiIC16 and DiIC18 in the plasma membrane of COS-7 cells under steady-state conditions as detected by confocal FRAP. (A) Example of images collected in a confocal FRAP experiment for GFP-NRas at the indicated times. The bleach strip is 4 μm wide. Postbleach images were acquired every second during the recovery phase. Bar, 10 μm. (B) Recovery curves for GFP-HRas (○), GFP-NRas (□), and GFP-KRas (▴) under steady-state conditions. Data shown are from a representative experiment (mean ± SE, N = 6–8 cells). (C) Recovery curves for DiIC16 (○) and DiIC18 (□) under steady-state conditions. Data are shown from a representative experiment (mean ± SE, N = 12–16 cells). All FRAP data were collected at 22°C at 1 s intervals.
FIGURE 2
FIGURE 2
Distribution of fluorescent lipid probes and GFP-Ras isoforms in cholesterol-loaded and -depleted cells. Averaged prebleach images from confocal FRAP experiments showing the distribution of DiIC16 (A, F, and K), DiIC18 (B, G, and L), GFP-HRas (C, H, and M), GFP-NRas (D, I, and N), and GFP-KRas (E, J, and O) at the surface of COS-7 cells under control conditions (AE), in cholesterol-depleted cells (FJ), and in cholesterol-loaded cells (KO). At longer times after loading, larger KRas-positive structures were also occasionally observed in the perinuclear region (not shown). Bar, 10 μm.
FIGURE 3
FIGURE 3
Effects of acute cholesterol depletion and cholesterol loading on the diffusional mobility of DiIC16 and DiIC18. (A) Recovery curves for DiIC16 under control conditions (•), after cholesterol depletion with MβCD (□), or after cholesterol loading using MβCD/cholesterol complexes (⋄). Data show the mean ± SE for 6–10 cells and are from a representative experiment (N = 3–5 independent experiments). (B) Recovery curves for DiIC18 under control conditions (•), after cholesterol depletion with MβCD (⋄), after treatment with MβCD/cholesterol complexes (□), or after treatment with MβCD followed by cholesterol repletion with MβCD/cholesterol complexes (▴). Data show the mean ± SE for 6–10 cells from a representative experiment (N = 3–5 independent experiments). (C) Mean D values for DiIC16 and DiIC18 diffusion in control (solid bars), MβCD-treated (open bars), MβCD/cholesterol-treated (shaded bars), and cholesterol-repleted (striped bars) cells. Data show the average from 2–3 independent experiments for a total of 20–50 cells. (D) Mean Mf values for DiIC16 and DiIC18 diffusion in (solid bars), MβCD-treated (open bars), MβCD/cholesterol-treated (shaded bars), and cholesterol-repleted (striped bars) cells. Data show the average from 2–3 independent experiments for a total of 20–50 cells.
FIGURE 4
FIGURE 4
Acute cholesterol depletion with MβCD slows Ras diffusion. (A) Distribution of D in control (open bars) versus MβCD-treated cells (shaded bars) for GFP-HRas, GFP-NRas, and GFP-KRas. Data are pooled from 5–7 independent experiments for each protein. (B) Mean Mf for control (open bars) versus MβCD-treated cells (shaded bars) for GFP-HRas, GFP-NRas, and GFP-KRas.
FIGURE 5
FIGURE 5
Acute cholesterol loading with MβCD/cholesterol complexes slows Ras diffusion. (AD) Images from a FRAP experiment of cholesterol-loaded cells expressing GFP-HRas. Times after bleach are as indicated. Scale bar, 10 μm. (EG) Mean fluorescence recovery curves for (E) GFP-HRas, (F) GFP-NRas, and (G) GFP-KRas under control conditions (•), in cholesterol-loaded cells (□), and after a second bleach of the same region of interest (ROI) in cholesterol-loaded cells (▴). Data are shown for a representative experiment (N = 4–7 cells). Data were collected at 1 s intervals; for clarity of presentation, not all data points are shown. Error bars, ± SE. (H) Mean D values for Ras diffusion under control conditions (solid bars), in cholesterol-loaded cells (open bars), and after a second bleach of the same ROI in cholesterol-loaded cells (shaded bars). Data are the average from 2–3 independent experiments for a total of 34–57 cells per protein. (I) Mean Mf values for Ras under control conditions (solid bars), in cholesterol-loaded cells (open bars), and after a second bleach of the same ROI in cholesterol-loaded cells (shaded bars). Data show the average from 2–3 independent experiments for a total of 34–57 cells per protein.
FIGURE 6
FIGURE 6
Distribution of fluorescent lipid probes and GFP-Ras isoforms in cells loaded or depleted of cholesterol using methods independent of MβCD. Averaged prebleach images from confocal FRAP experiments showing the distribution of DiIC16 (A, E, and I), GFP-HRas (B, F, and J), GFP-NRas (C, G, and K), and GFP-KRas (D, H, and L) at the surface of COS-7 cells under control conditions (AD), in cholesterol-depleted cells (EH), and in cholesterol-loaded cells (IL). Bar, 10 μm.
FIGURE 7
FIGURE 7
Comparison of the effects of different methods of cholesterol depletion and loading on the diffusional mobility of DiIC16 and Ras. Recovery curves are shown for DiIC16 (A and E), GFP-HRas (B and F), GFP-NRas (C and G), and GFP-KRas (D and H). (AD) Cells were either mock depleted (black squares), cholesterol depleted using MβCD (blue circles), or depleted of cholesterol overnight (red triangles) as described in Materials and Methods before FRAP experiments. Insets show a closeup of the boxed regions. (EH) Cells were either mock loaded (black circles), cholesterol loaded using MβCD/cholesterol complexes (blue squares), or loaded with cholesterol from an ethanol stock for 6 h (red triangles) as described in Materials and Methods before FRAP experiments. Recovery curves are representative of 3–4 independent experiments (mean ± SE).

Similar articles

Cited by

References

    1. Saffman, P. G., and M. Delbrück. 1975. Brownian motion in biological membranes. Proc. Natl. Acad. Sci. USA. 72:3111–3113. - PMC - PubMed
    1. Jacobson, K., A. Ishihara, and R. Inman. 1987. Lateral diffusion of proteins in membranes. Annu. Rev. Physiol. 49:163–175. - PubMed
    1. Edidin, M. 1996. Getting there is only half the fun. Curr. Top. Membr. 43:1–13.
    1. Edidin, M. 2001. Shrinking patches and slippery rafts: scales of domains in the plasma membrane. Trends Cell Biol. 11:492–496. - PubMed
    1. Kusumi, A., and Y. Sako. 1996. Cell surface organization by the membrane skeleton. Curr. Opin. Cell Biol. 8:566–574. - PubMed