. 2005 Aug;89(2):1374-88.
doi: 10.1529/biophysj.104.050682. Epub 2005 May 27.

Molecularly engineered PEG hydrogels: a novel model system for proteolytically mediated cell migration

Affiliations

Molecularly engineered PEG hydrogels: a novel model system for proteolytically mediated cell migration

G P Raeber et al. Biophys J. 2005 Aug.

Abstract

Model systems mimicking the extracellular matrix (ECM) have greatly helped in quantifying cell migration in three dimensions and elucidated the molecular determinants of cellular motility in morphogenesis, regeneration, and disease progression. Here we tested the suitability of proteolytically degradable synthetic poly(ethylene glycol) (PEG)-based hydrogels as an ECM model system for cell migration research and compared this designer matrix with the two well-established ECM mimetics fibrin and collagen. Three-dimensional migration of dermal fibroblasts was quantified by time-lapse microscopy and automated single-cell tracking. A broadband matrix metalloproteinase (MMP) inhibitor and tumor necrosis factor-alpha, a potent MMP-inducer in fibroblasts, were used to alter MMP regulation. We demonstrate a high sensitivity of migration in synthetic networks to both MMP modulators: inhibition led to an almost complete suppression of migration in PEG hydrogels, whereas MMP upregulation increased the fraction of migrating cells significantly. Conversely, migration in collagen and fibrin proved to be less sensitive to the above MMP modulators, as their fibrillar architecture allowed for MMP-independent migration through preexisting pores. The possibility of molecularly recapitulating key functions of the natural extracellular microenvironment and the improved protease sensitivity makes PEG hydrogels an interesting model system that allows correlation between protease activity and cell migration.


Figures
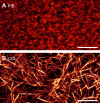
FIGURE 1
FIGURE 1
Representative CLSM images of 2 mg/ml fibrin (A) and 2 mg/ml reconstituted type I collagen (B) demonstrate considerable architectural discrepancy between the two biopolymers. Both matrices show a fibrillar structure, but with pore size differing by 1–2 orders of magnitude. The pore structures were quantified as reported in Table 1. Scale bar, 20 μm.
FIGURE 2
FIGURE 2
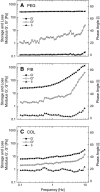
Typical mechanical spectra for PEG (A), fibrin (B), and collagen (C). G′ exhibited a plateau at lower frequencies and G″ was typically 1–3 orders of magnitude smaller than G′, representing the predominantly elastic behavior of all gels. The difference in cross-linking density resulting from distinct gel formation mechanisms (covalent bond formation in PEG and partially in fibrin; physical cross-linking in collagen and partly in fibrin) is visible by the magnitude of the phase angle and the increase of the moduli at higher frequencies.
FIGURE 3
FIGURE 3
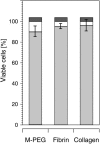
Mean cell viability (shaded) from five fields of three gels per condition are shown. Error bars represent SD of the mean sample values. Dark shaded portions of the bars above the 100% limit indicate dead cells after harvesting, before gelation (∼3.5%).
FIGURE 4
FIGURE 4
Cell morphology was analyzed by the projected cell area and the normalized ellipse compactness as a function of the substrate. (A and D) The MMP-sensitive cross-linker allows HFFs to spread and attain cell shapes in synthetic M-PEG gels (M-PEG) very similarly to HFFs in biopolymers (FIB, COL). In contrast, HFFs are not able to form a spindle-shaped morphology in plasmin-sensitive PEG hydrogels (P-PEG) as seen by the increased compactness and a decrease in projected cell area. (B) For TNF-α-treated cultures, no differences in morphometric parameters were detected. (C) MMP-inhibited cultures (GM6001) in fibrin showed a significantly increased mean compactness (n = 4; ∼400 cell tracks; (*) p < 0.05; (**) p < 0.01; (***) p < 0.001 for difference to M-PEG or between groups if indicated with brackets; nonparametric multiple comparison with Dunn's test, α-level 0.01). (E) Representative brightfield images of HFFs within the four materials. (F) Representative reconstructed CLSM images of HFFs in MMP-sensitive PEG hydrogels (M-PEG), 2 mg/ml fibrin (FIB), and 2 mg/ml reconstituted type I collagen (COL) stained for f-actin (rhodamine-phalloidin, green) and nuclei (DAPI, red). Scale bars, 100 μm (E) and 30 μm (F).
FIGURE 5
FIGURE 5
Polar plots of migrated distance and histograms of migration parameters for the four matrices. Each track is assigned either to a migrating (black) or a nonmigrating (shaded) group based on the persistence length criterion Lcrit ≥ 3 μm. (A) Cell tracks were segmented into 60-min parts. Distance and direction migrated during that time is displayed in polar coordinates (r, φ), where r is the distance in μm and φ the angle from start to end-point. Nonmigrating cells are confined to the center. For P-PEG, very few cells were detected as migrating. With increasing pore size, migrated distances increase noticeably. No preferential direction was apparent. (B) Histograms show the pooled data of three independent experiments consolidating n cell tracks with a minimal length of 150 min. Depicted are mean cell speed (left column) and persistence time (right column) of individual tracks from migrating (black) or nonmigrating (shaded) cells, including a nonparametric density curve for the whole population. The number of cells having a mean speed or persistence time within a certain bin of the histogram is divided by the total number of cells to give the normalized number indicated on the probability axis. Tracks with persistence time values derived from regression analysis with R2 < 0.75 were excluded from histograms.
FIGURE 6
FIGURE 6
Typical gelatin zymogram showing TNF-α-induced production of proMMP-9 (92 kDa) by fibroblasts within M-PEG gels (M-PEG), fibrin (FIB), and collagen (COL). Fibroblasts were cultured for 2 days before TNF-α was added at a concentration of 5 ng/mL for 25 h. Cell culture in collagen matrices led to increased gelatinolytic activity at 62 kDa, corresponding to active MMP-2. S, MMP-2 and -9 standard.
FIGURE 7
FIGURE 7
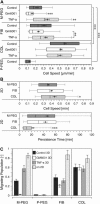
Single-cell behavior as a function of MMP stimulation or inhibition with 5 ng/ml TNF-α (TNF-a) or 10 μM GM6001 (GM6001) in MMP-degradable PEG gels (M-PEG), plasmin-degradable PEG gels (P-PEG), 2-mg/ml fibrin gels (FIB), and 2-mg/ml collagen gels (COL). Mean cell speed (A) was analyzed from tracks longer than 10 time intervals and displayed as box plots ranging from the 25th to 75th percentile including the median and whiskers from the 10th to 90th percentile. Diamonds and error bars indicate the group mean ± SE. Additionally, cell migration on the surface of identical materials was quantified (B). The cell populations were split into a migrating and a nonmigrating group, based on the persistence distance criterion L ≥ 3 μm, to visualize differences between materials, migration on the gel surface and within the materials, and the sensitivity to MMP modulation (C), mean ± SD between different samples, n ≥ 4). Migration on the surface of P-PEG was not investigated. Statistical analysis was performed by multiple comparisons with a nonparametric Dunn's rank sum test. For each material, the MMP inhibited and TNF-α-stimulated samples were compared to the control and the controls were compared across all materials with M-PEG ((*) p < 0.05; (**) p < 0.01; (***) p < 0.001).

References

    1. Ridley, A. J., M. A. Schwartz, K. Burridge, R. A. Firtel, M. H. Ginsberg, G. Borisy, J. T. Parsons, and A. R. Horwitz. 2003. Cell migration: integrating signals from front to back. Science. 302:1704–1709. - PubMed
    1. Lauffenburger, D. A., and A. F. Horwitz. 1996. Cell migration: a physically integrated molecular process. Cell. 84:359–369. - PubMed
    1. Friedl, P., and K. Wolf. 2003. Tumour-cell invasion and migration: diversity and escape mechanisms. Nat. Rev. Cancer. 3:362–374. - PubMed
    1. Wolf, K., R. Muller, S. Borgmann, E. B. Brocker, and P. Friedl. 2003. Amoeboid shape change and contact guidance: T-lymphocyte crawling through fibrillar collagen is independent of matrix remodeling by MMPs and other proteases. Blood. 102:3262–3269. - PubMed
    1. Wolf, K., I. Mazo, H. Leung, K. Engelke, U. H. von Andrian, E. I. Deryugina, A. Y. Strongin, E. B. Brocker, and P. Friedl. 2003. Compensation mechanism in tumor cell migration: mesenchymal-amoeboid transition after blocking of pericellular proteolysis. J. Cell Biol. 160:267–277. - PMC - PubMed

Publication types

LinkOut - more resources