. 2005 Jun;138(2):1083-96.
doi: 10.1104/pp.104.058032. Epub 2005 May 27.

The Arabidopsis transcription factor MYB12 is a flavonol-specific regulator of phenylpropanoid biosynthesis

Affiliations

The Arabidopsis transcription factor MYB12 is a flavonol-specific regulator of phenylpropanoid biosynthesis

Frank Mehrtens et al. Plant Physiol. 2005 Jun.

Abstract

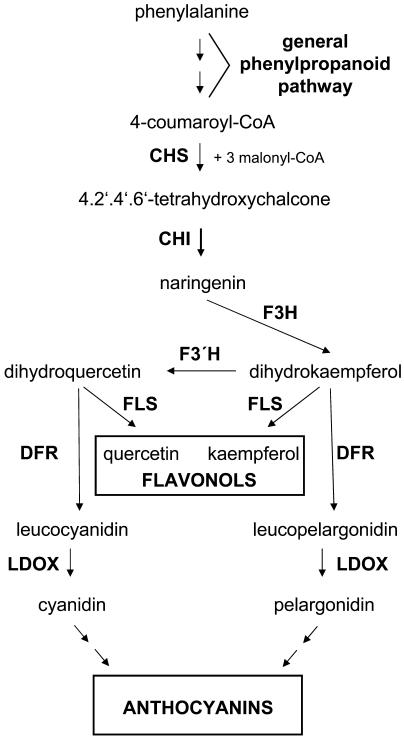
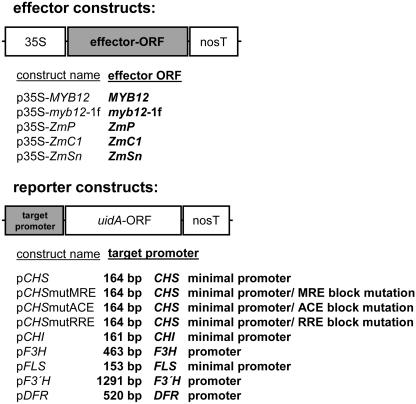
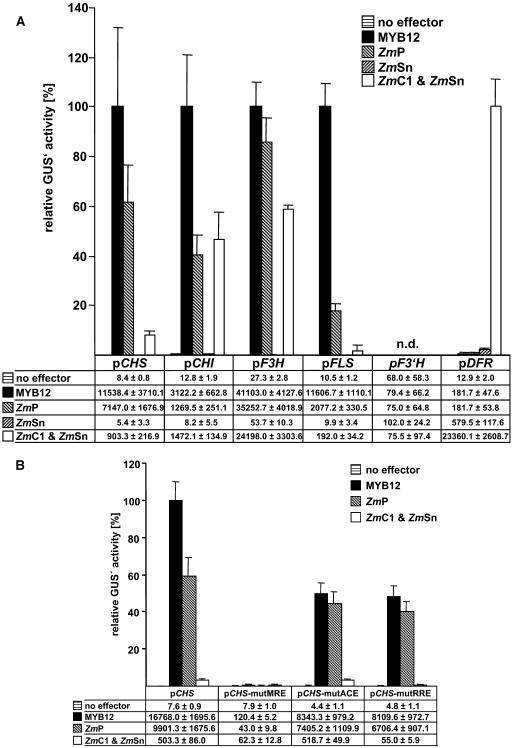
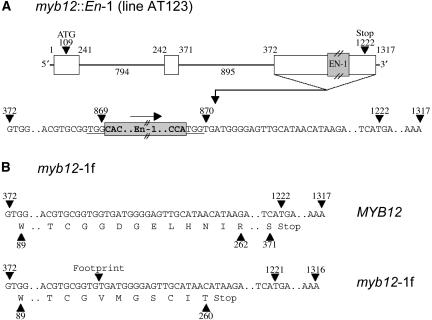
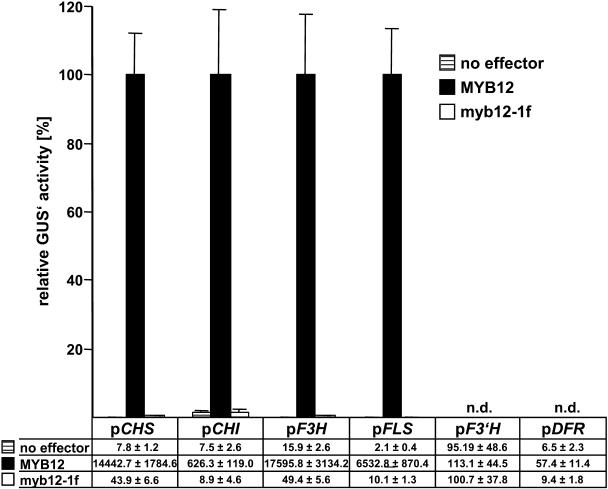
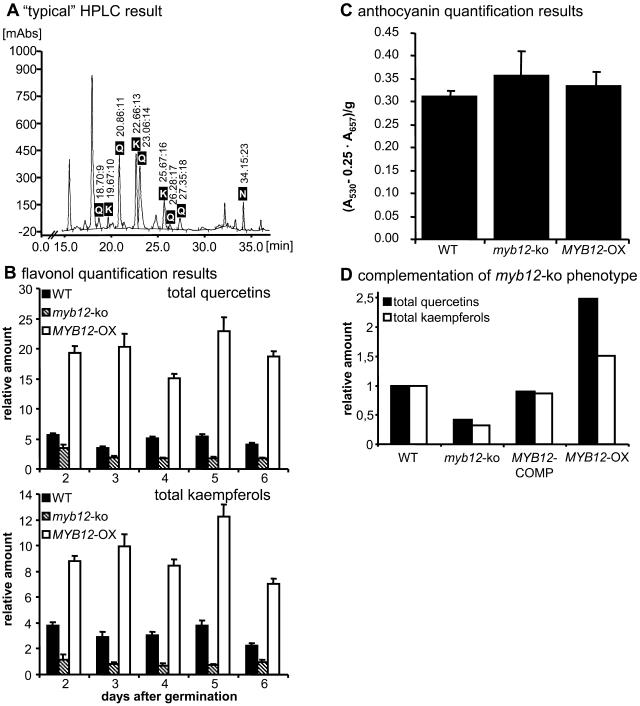
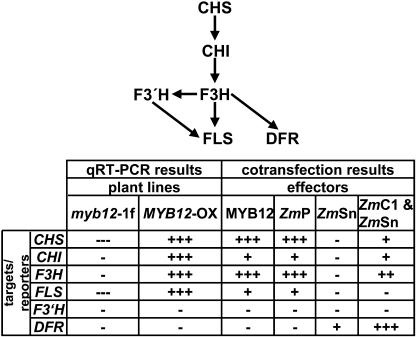
Comprehensive functional data on plant R2R3-MYB transcription factors is still scarce compared to the manifold of their occurrence. Here, we identified the Arabidopsis (Arabidopsis thaliana) R2R3-MYB transcription factor MYB12 as a flavonol-specific activator of flavonoid biosynthesis. Transient expression in Arabidopsis protoplasts revealed a high degree of functional similarity between MYB12 and the structurally closely related factor P from maize (Zea mays). Both displayed similar target gene specificity, and both activated target gene promoters only in the presence of a functional MYB recognition element. The genes encoding the flavonoid biosynthesis enzymes chalcone synthase, chalcone flavanone isomerase, flavanone 3-hydroxylase, and flavonol synthase were identified as target genes. Hence, our observations further add to the general notion of a close relationship between structure and function of R2R3-MYB factors. High-performance liquid chromatography analyses of myb12 mutant plants and MYB12 overexpression plants demonstrate a tight linkage between the expression level of functional MYB12 and the flavonol content of young seedlings. Quantitative real time reverse transcription-PCR using these mutant plants showed MYB12 to be a transcriptional regulator of CHALCONE SYNTHASE and FLAVONOL SYNTHASE in planta, the gene products of which are indispensable for the biosynthesis of flavonols.


Figures

Figure 1.
Figure 1.
Simplified, schematic representation of the biosynthesis of flavonols and anthocyanidins. Abbreviations of the enzyme designations are CHS, chalcone synthase; CHI, chalcone flavanone isomerase; F3H, flavanone 3-hydroxylase; FLS, flavonol synthase; F3′H, flavonoid 3′-hydroxylase; DFR, dihydroflavonol 4-reductase. Note that for the biosynthesis of flavonols the action of FLS is required while for the formation of anthocyanins DFR is necessary.
Figure 2.
Figure 2.
Schematic representations of the effector and reporter constructs used for transient expression analyses. Effector constructs contain the cauliflower mosaic virus 35S promoter fused to the respective effector ORFs followed by the nopaline synthase terminator (nosT). Reporter constructs contain the respective target promoters fused to the uidA-ORF followed by nosT. The length of the individual promoter fragments used is indicated. The three mutated variants of the CHS minimal promoter are named according to the mutated cis-element, respectively.
Figure 3.
Figure 3.
Cotransfection analysis of target gene specificities and cis-element requirements in At7 protoplasts. A, Cotransfection assays to determine the activation of the promoters of flavonoid biosynthesis genes by MYB12, ZmP, ZmSn, and the combination of ZmC1/ZmSn. The mean value of luciferase activities was 6,800 RLU μg−1 s−1. Samples were incubated for 20 h in the dark at 26°C prior to harvesting. B, Identification of cis-elements required for the activation of the CHS minimal promoter by MYB12, ZmP, and ZmC1+ZmSn. The mean value of luciferase activities was 7,600 RLU μg−1 s−1. Samples were incubated for 8 h in the dark at 26°C prior to harvesting. A and B, The reporter/effector combinations used are indicated. Columns represent the relative GUS′ activity in cotransfection experiments using discrete reporter/effector combinations. The highest occurring GUS′ activity measured for each individual reporter construct was set to 100%. Each column represents the mean of six independent measurements. Error bars illustrate the sd of mean values. The data tables below the graphs give the respective absolute GUS′ activity values measured. n.d., Not determined.
Figure 4.
Figure 4.
Genomic structure of myb12 alleles. A, Schematic overview and partial structure of the third exon of the originally isolated myb12En-1 line (AT123). White boxes symbolize exons and the connecting lines introns. Numerical values above exons indicate nucleotide positions relative to the transcription start site. Intron lengths are indicated. The En-1 transposon insertion took place between nucleotides at positions 869 and 870. The nucleotides of the 3-bp target sequence duplication of the En-1 transposon are highlighted by underscore. The arrow upside the transposon marks its orientation. B, Comparison of nucleotide and protein sequence of wild-type (MYB12) and myb12-1f alleles. Only the third exon is shown. In the genetically stable myb12-1f line the deletion of the guanidine nucleotide at position 869 leads to the premature termination of translation. The myb12-1f protein comprises only 260 amino acids compared to 370 in the wild-type case. In addition the sequence of the last seven amino acids is altered at six positions.
Figure 5.
Figure 5.
The myb12-1f allele is not functional. The reporter/effector combinations used are indicated. Columns represent the relative GUS′ activity in cotransfection experiments using discrete reporter/effector combinations. The highest occurring GUS′ activity measured for each reporter construct was set to 100%. Each column represents the mean of six independent measurements. Error bars illustrate the sd of mean values. The data table below the graph gives the respective absolute GUS′ activity values measured. The mean value of luciferase activities was 4,500 RLU μg−1 s−1. Samples were incubated for 8 h in the dark at 26°C prior to harvesting.
Figure 6.
Figure 6.
Biochemical myb12-ko phenotype. A, Representation of a selected HPLC result. The example shows the chromatogram obtained from a methanolic extract of 2-d-old wild-type seedlings. Peaks identified as corresponding to quercetin or kaempferol derivatives and the internal standard naringenin are labeled. Retention times are indicated above the peaks. K, Kaempferol; N, naringenin; Q, quercetin. B, Relative quantification of flavonols (total quercetins and total kaempferols) in methanolic extracts of developing Arabidopsis seedlings by HPLC analysis. The age and the genotype of the seedlings (WT, wild type) analyzed are indicated. Naringenin was used as an internal standard (relative amount arbitrarily set as one). Error bars indicate the sd of the average of relative quercetin/kaempferol amounts determined as triplicates in two independent biological replicates. C, Photometric determination of anthocyanin content in methanolic extracts of 6-d-old Arabidopsis seedlings. A530, Absorption at 530 nm; A657, absorption at 657 nm. Error bars represent the sd of the average from a total of six measurements using two independent biological replicates. D, Complementation of the myb12-ko phenotype by transformation of myb12-ko plants with a 4.5-kb MYB12 genomic fragment. Relative flavonol contents in methanolic extracts of 6-d-old wild-type, myb12-ko, MYB12-COMP, and MYB12-OX plants were determined by HPLC.
Figure 7.
Figure 7.
CHS and FLS are primary target genes of MYB12. A, Determination of PCR efficiencies in quantitative real time PCR. The example shows the determination for MYB12 as PCR target. The plot of the natural logarithm of template concentration against the threshold cycle number results in a linear standard curve. The efficiency of the PCR system used can be calculated from the slope of the graph. The equation and the corresponding correlation coefficient of the linear regression line is shown. The calculated efficiency value is also indicated. For details of the method see “Materials and Methods.” E, PCR efficiency; ln, natural logarithm; R2, correlation coefficient of linear regression line. B, Results of quantitative real time RT-PCR analyses of RNA from developing Arabidopsis seedlings. Columns represent the relative expression levels of the distinct target genes tested. The mRNA amount in 2-d-old wild-type (WT) seedlings served as a calibrator for the calculation of relative expression levels in all cases (relative expression arbitrarily set to one). Relative expression was determined in triplicate measurements in two independent biological replicates. The age and the genotype of the seedlings analyzed are indicated.
Figure 8.
Figure 8.
Overview of MYB12 effects on flavonoid gene expression. The top of the figure shows a schematic representation of the enzymatic steps of flavonoid biosynthesis. The table below summarizes the results of the quantitative real time RT-PCR of mutant plants and the cotransfection analyses performed. “+” indicates weak, “++” medium, and “+++” strong gene expression or activation of reporter gene transcription, respectively; “−” indicates no effect on target gene expression or on activation of reporter gene transcription, “---” indicates strong reduction in target gene expression.

References

    1. Andersson KB, Berge T, Matre V, Gabrielsen OS (1999) Sequence selectivity of c-Myb in vivo. Resolution of a DNA target specificity paradox. J Biol Chem 274: 21986–21994 - PubMed
    1. Armstrong GA, Weisshaar B, Hahlbrock K (1992) Homodimeric and heterodimeric leucine zipper proteins and nuclear factors from parsley recognize diverse promoter elements with ACGT cores. Plant Cell 4: 525–537 - PMC - PubMed
    1. Baudry A, Heim MA, Dubreucq B, Caboche M, Weisshaar B, Lepiniec L (2004) TT2, TT8, and TTG1 synergistically specify the expression of BANYULS and proanthocyanidin biosynthesis in Arabidopsis thaliana. Plant J 39: 366–380 - PubMed
    1. Bechtold N, Ellis J, Pelletier G (1993) In planta Agrobacterium mediated gene transfer by infiltration of adult Arabidopsis thaliana plants. C R Acad Sci Paris Life Sci 316: 1194–1199
    1. Becker D, Kemper E, Schell J, Masterson R (1992) New plant binary vectors with selectable markers located proximal to the left T-DNA border. Plant Mol Biol 20: 1195–1197 - PubMed

Publication types