

doi: 10.1128/MCB.25.12.5031-5039.2005.
Active Src elevates the expression of beta-catenin by enhancement of cap-dependent translation
Affiliations
- PMID: 15923620
- PMCID: PMC1140589
- DOI: 10.1128/MCB.25.12.5031-5039.2005
Item in Clipboard
Active Src elevates the expression of beta-catenin by enhancement of cap-dependent translation
Mol Cell Biol.
2005 Jun.
Abstract
The proto-oncogene pp60(c-Src) (c-Src) is activated in many types of cancer and contributes to the transformed phenotype of the tumor, although its role is not yet fully understood. Here we report that active Src elevates the levels of beta-catenin by enhancing cap-dependent translation. Src induces phosphorylation of the eukaryotic initiation factor 4E via the Ras/Raf/ERK pathway and the phosphorylation of its inhibitor 4E-BP1 via the PI3K/mTOR pathway. Activated Src enhances the accumulation of nuclear beta-catenin and enhances its transcriptional activity, elevating target genes such as cyclin D1. This novel activation of the Wnt pathway by Src most probably contributes to the oncogenic phenotype of cancer cells.
Figures
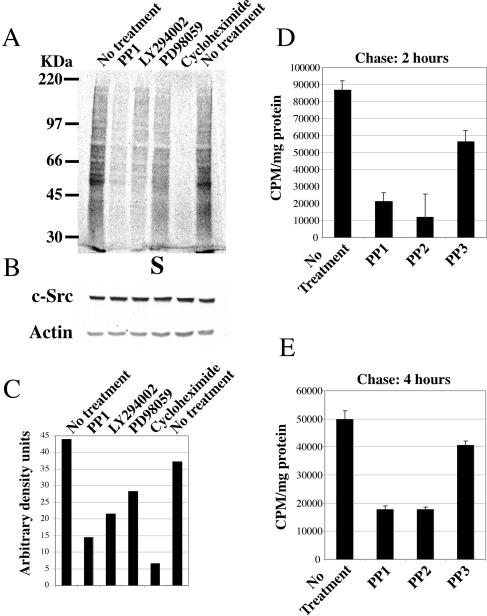
Src kinase activity regulates protein synthesis. (A) 35S labeling of CSH12 cells. Cells were seeded on six-well plates (Nunc) (2 × 10⁵ cells/well) and after 24 h the cells were metabolically labeled with the 35S-labeled methionine-cysteine Promix as described in Materials and Methods. Equal amounts of protein from each sample were separated on SDS-10% PAGE, transferred to a nitrocellulose membrane, and the membrane was exposed to film. (B) After radioactive exposure, the membrane was probed with anti-Src (MAb 327) and anti-actin, to verify that equal amounts of protein were loaded. (C) Quantification of 35S labeling of CSH12 cells. Quantification of whole-lane mean density, using the MacBass 2.5 phosphorimager program (D) CSH12 cells (2 × 10⁵ cells/well) were seeded on six-well plates. Twenty-four hours later, the cells were starved for methionine and cysteine for 1 h in the presence of PP1, PP2, or PP3 as indicated. The cells were then labeled with 35S-labeled methionine-cysteine Promix, 50 μCi/ml, at 37°C for 1 h, in the presence of the indicated inhibitors. Cells were then washed with PBS, and incubated for 2 or 4 h (E) in medium containing excess (5 mM) nonradioactive l -methionine. The cells were then washed with PBS and lysed with sample buffer. Radioactivity was measured as described in Materials and Methods. Error bars represent standard error of the mean of three independent experiments.
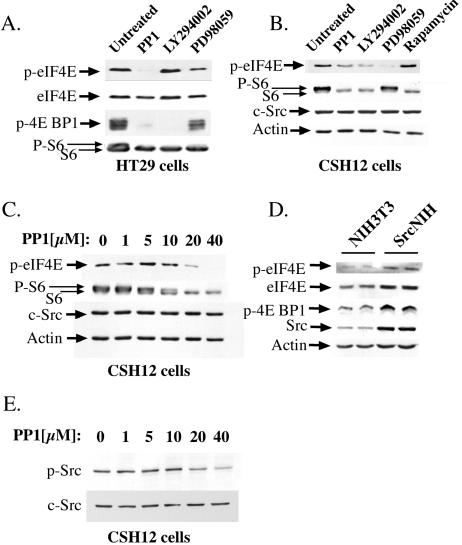
The effects of Src, MEK1, mTOR, and PI3-kinase inhibitors on the phosphorylation of eIF4E, eIF4E BP1 and S6 proteins. (A) HT29 cells were seeded on six-well plates (Nunc) (4 × 10⁵ cells/well). Twenty-four hours later, the medium was replaced with medium containing the indicated inhibitors for 3 h (20 μM PP1, 20 μM LY294002 or 50 μM PD98059). Cells were then lysed with sample buffer and the lysates subjected to SDS-PAGE. After Western blotting, the membrane was probed with the following antibodies: anti-phospho-Ser-209 of eIF4E (p-eIF4E), anti-phospho-Thr-70 of eIF4E BP1 (p-4E BP1), anti-S6, and after stripping, anti-eIF4E. The higher band detected with anti-S6 represents its phosphorylated form. (B) CSH12 cells were seeded on six-well plates (2 × 10⁵ cells/well; Nunc) and after 24 h cells were treated for 3 h with 20 μM PP1, 20 μM LY294002, 50 μM PD98059, or 50 nM rapamycin. Cells were then lysed with sample buffer. After Western blotting, the membrane was probed with anti- phospho-serine 209 of eIF4E, anti-S6, anti-Src and anti-actin. (C) CSH12 cells were seeded on six-well plates (2 × 10⁵ cells/well; Nunc) and after 24 h cells were treated for 3 h with PP1 at the indicated concentrations. After Western blotting, the membrane was probed as in B. (D) NIH 3T3 and SrcNIH cells were seeded on six-well plates (2 × 10⁵ cells/well; Nunc) and after 24 h were lysed. After Western blotting, the blot was probed as for panel A. (E) CSH12 cells were seeded on six-well plates and after 24 h were treated for 3 h with PP1 at the indicated concentrations. After Western blotting, the membrane was probed with anti-phospho-Src (Y416) and anti-Src.
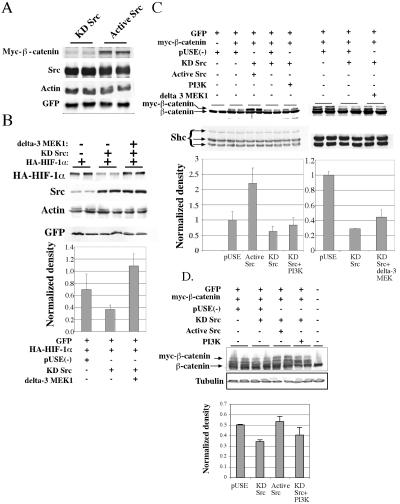
Active MEK1 overrides the translational inhibition caused by expression of kinase-dead Src. (A) CSH12 cells were transfected in six-well plates with 0.2 μg of Myc-β-catenin expression plasmid, 0.4 μg of HA-GSK3 plasmid, 0.2 μg of flag-Axin plasmid, 0.4 μg of pEGFP plasmid, and 1 μg of KD or active Src plasmids as indicated. 48 h after transfection, cells were lysed with sample buffer, the lysates were subjected to SDS-PAGE and, after Western blotting, were probed with anti-Myc antibody (9E10; 1:1,000; Santa Cruz), anti-GFP (1:5,000; Santa Cruz), anti-Src, and anti-actin as in Fig. 2. (B) CSH12 cells were grown in six-well plates and cotransfected with 50 ng of HA-HIF-1α expression plasmid and GFP expression plasmid, as well as empty plasmid, or plasmids coding for KD Src, or KD Src plus active MEK1 (ΔMEK1) as indicated. Forty-eight hours later, cells were lysed with sample buffer and after Western blotting the membrane was probed with anti-HIF-1α, anti-Src anti-GFP, and anti-actin. (C) CSH12 cells were grown on six-well plates and cotransfected with 200 ng of myc-β-catenin, 400 ng HA-GSK3β, 200 ng Flag-Axin, and GFP expression plasmids, as well as empty plasmid, KD Src plasmid, or KD Src plasmid (500 ng) plus active Src plasmid, active MEK1 (ΔMEK1) plasmid, or a myr-PI3K plasmid (600 ng) as indicated. Forty-eight hours later, cells were lysed with sample buffer and after Western blotting the membrane was probed with anti Shc (1:1,000; Santa Cruz) as a loading control and anti β-catenin (1:2,000; Santa Cruz). Results were normalized to Shc. Standard deviation between duplicates is shown. (D) HEK-293 cells were grown on six-well plates and cotransfected with 200 ng of myc-β-catenin, 400 ng HA-GSK3β, 300 ng Flag-Axin and 0.5 μg GFP expression plasmids, as well as 1.1 μg of empty plasmid (pUSE), or 500 ng KD Src plasmid, plus 600 ng of either empty plasmid, active Src plasmid, or a myr-PI3K plasmid, as indicated. Forty-eight hours later, cells were lysed with sample buffer and run on SDS-8% PAGE. After blotting, the membrane was probed with anti-β-catenin (1:6,000; Transduction Laboratories), and anti-α-tubulin (1:40,000; Sigma). Results were normalized to tubulin. Standard deviation between duplicates is shown.
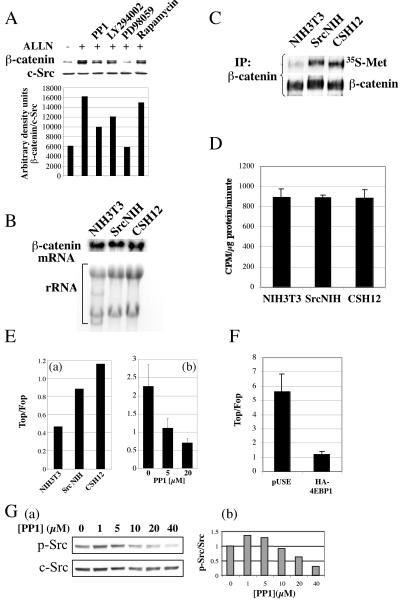
Active Src enhances the synthesis of β-catenin protein and increases β-catenin dependent transcriptional activation. (A) Saos-2 cells (4 × 10⁵ cells/well) were seeded on six-well plates (Nunc). After 24 h, the medium was replaced with medium lacking or containing an inhibitor (20 μM PP1, 20 μM LY294002, 50 μM PD98059, or 50 nM rapamycin) for 30 min. These media were then replaced with media containing the respective inhibitor and a proteasome inhibitor (200 μM ALLN; Calbiochem) for an additional 5 h. Cells were then lysed with sample buffer and after Western blotting were probed with anti-β-catenin and anti-c-Src as in Fig. 2. (B) NIH 3T3, SrcNIH, and CSH12 cells (106) were grown in 10-cm dishes. After 24 h RNA was extracted and 20 μg of total RNA were subjected to Northern blotting. The blot was hybridized with a probe for β-catenin (C) NIH 3T3, SrcNIH, and CSH12 cells were grown in 10-cm dishes. After 24 h the medium was replaced with methionine and cysteine deficient medium for 1 h, and later 100 μCi/ml of 35S-labeled Met-Cys Promix was added with 200 μM ALLN for 45 min as described in Materials and Methods. Proteins were extracted, size fractionated in SDS-PAGE, and blotted. The membrane was exposed to film and afterwards probed for β-catenin protein using anti-β-catenin antibody. (D) NIH 3T3, SrcNIH, and CSH12 cells were seeded in six-well plates (140,000 cells/well). Twenty-four hours later, cells were labeled with 35S-labeled methionine-cysteine Promix for 45 min and total protein synthesis rates were measured as described in Materials and Methods. Error bars represent duplicates from a representative experiment out of two independent experiments. (E) (a) NIH 3T3, SrcNIH, and CSH12 cells were transfected with Topflash or Fopflash encoding plasmids (see Materials and Methods) and Topflash activity was normalized to Fopflash activity. (b) CSH12 cells were transfected with Topflash- or Fopflash-encoding plasmids and 24 h later were treated with PP1 at the indicated concentrations for an additional 24 h. (F) HEK-293 cells were seeded on six-well plates (200,000 cell/well). Twenty-four hours later, cells werecotransfected with 1 μg/well of Topflash or Fopflash and 1 μg/well of either empty plasmid (pUSE) or HA-4EBP1. Forty-eight after transfection, Topflash activity was normalized to Fopflash activity. Error bars represent duplicates from a representative experiment out of two independent experiments. (G) (a) CSH12 cells were treated for 24 h with PP1 at the indicated concentration. After Western blotting, the membrane was probed with anti-phospho-Src (Y416) and anti-Src. (b) Phospho-Src band densities were quantitated using the NIH image 1.6 program, and the results were normalized to c-Src.
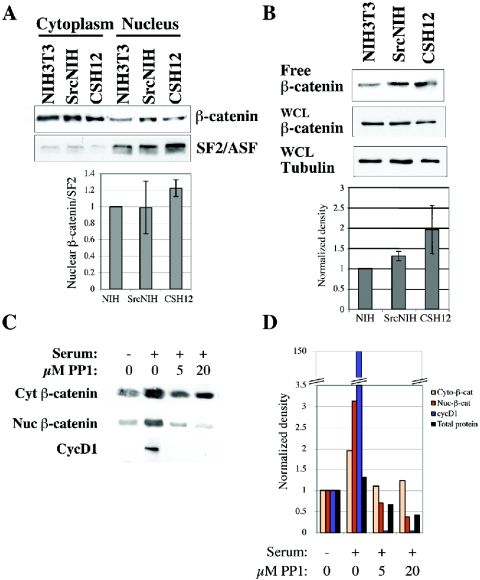
Src activity affects nuclear or free β-catenin levels. (A) NIH 3T3, SrcNIH, and CSH12 cells were seeded (106 cells/10-cm plate) and 24 h later were starved for 48 h in medium containing 0.2% serum. Cells were then lysed and fractionated into cytoplasmic and nuclear fractions as described in Materials and Methods. After Western blotting, the membrane was probed with the indicated antibodies (see Materials and Methods). Results were normalized to SF2/ASF nuclear marker levels. Error bars represent standard error of the mean of three independent experiments. (B) NIH 3T3, SrcNIH, and CSH12 cells were seeded and starved as described for panel A. Cells were lysed with RIPA buffer and cleared lysates were affinity-purified with GST-E-cadherin cytoplasmic tail (see Materials and Methods). The beads were boiled in sample buffer, and after Western blotting, the membrane was probed with the anti β-catenin antibody. Samples from whole-cell lysates (prior to pull-down) were also subjected to Western analysis, and the membrane was probed with anti-β-catenin and anti-α-tubulin antibodies. Results were normalized either to tubulin or to Shc. Error bars represent standard error of the mean of three independent experiments. (C) SrcNIH cells were seeded (6 × 10⁵ cells) on 10-cm plates and starved (0.2% serum) for 24 h. Cells were activated with medium containing 10% serum for 24 h in the absence or presence of the Src kinase inhibitor PP1 at the indicated concentrations. Cells were lysed and fractionated into cytoplasmic and nuclear fractions using the NE-PER nuclear and cytoplasmic extraction kit (Pierce) according to the manufacturer's instructions. Equal volumes of each sample were loaded and subjected to SDS-PAGE. Protein quantities in each sample were determined and are shown in the graph. After Western blotting, the membrane was probed with antibodies to cyclin D1 or β-catenin. (D) The density of the bands was measured using NIH IMAGE 1.6 program and the graphs show the fold change in the density compared to the levels before activation (time zero). Shown is a representative experiment out of two independent experiments.
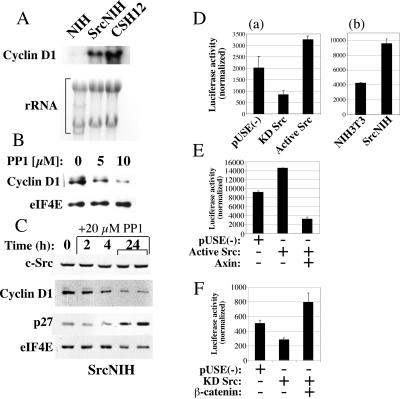
Src elevates the transcription of the β-catenin target gene, cyclin D1. (A) NIH 3T3, SrcNIH, and CSH12 cells (106) were grown in 10 cm dishes. After 24 h, total RNA was extracted and 20 μg of RNA were subjected to Northern blotting. The blot was hybridized with a probe for cyclin D1. (B) CSH12 cells (2 × 10⁵/well) were seeded and treated with PP1 at the indicated concentrations for 24 h. After Western blotting the membrane was probed with anti-cyclin D1 and anti-eIF4E as in Fig. 2. (C) SrcNIH cells (2 × 10⁵/well) were seeded and treated with PP1 for the indicated times (duplicates are shown at 24 h). After Western blotting, the membrane was probed with anti-cyclin D1, anti-eIF4E, anti c-Src, and anti p27. (D) (a) CSH12 cells were cotransfected with encoding luciferase reporter tethered to the cyclin D1 promoter (−1,745-bp) CMV-β-Gal control plasmid and an empty vector [pUSE(−)] or plasmids encoding the Src mutants, as indicated. Luciferase activity was normalized to β-Gal activity. Experiments were repeated three times, with duplicates in each experiment. (b) The cyclin D1 promoter (−1,745-bp)-luc reporter plasmid was transfected into NIH 3T3 and SrcNIH cells and the luciferase activity was normalized to that of β-Gal. (E) CSH12 cells were cotransfected with the cyclin D1 promoter (−1745 bp)-luc reporter, CMV-β-Gal control plasmid, and one or a pair of the following: luciferase and β-Gal empty plasmid [pUSE(−)], active Src, or active Src and axin. (F) In another experiment, cells were cotransfected with the reporters and one or a pair of the following as indicated: empty plasmid [pUSE(−)], KD Src, and β-catenin. Forty-eight hours after transfection luciferase activity was measured and normalized to β-Gal activity. All samples were prepared in duplicates. Shown are results derived from three independent experiments.
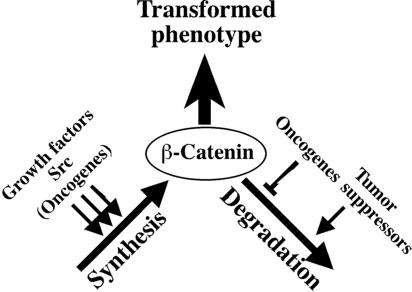
Src contributes to the regulation of β-catenin by enhancing its synthesis. The steady state levels of β-catenin protein are determined by the balance between the rates of degradation and synthesis. Any protein or oncogene that enhances translation, or stimulus that inhibits degradation, will elevate the levels of β-catenin, which contributes to the transformed phenotype.
References
Publication types
MeSH terms
Substances
LinkOut - more resources
Full Text Sources
Molecular Biology Databases
Research Materials
Miscellaneous