. 2005 Jul;8(7):961-8.
doi: 10.1038/nn1477.

In vivo auditory brain mapping in mice with Mn-enhanced MRI

Affiliations

In vivo auditory brain mapping in mice with Mn-enhanced MRI

Xin Yu et al. Nat Neurosci. 2005 Jul.

Abstract

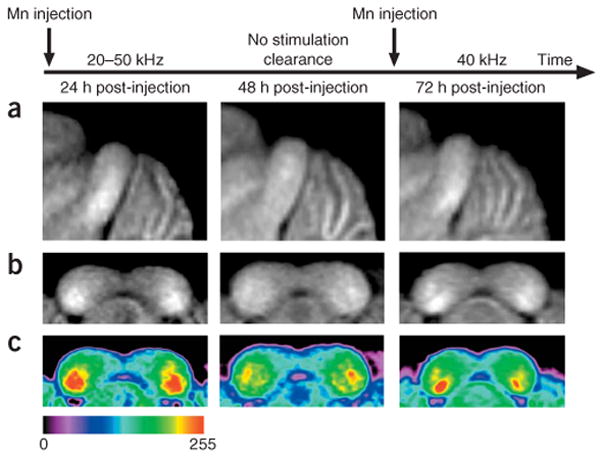
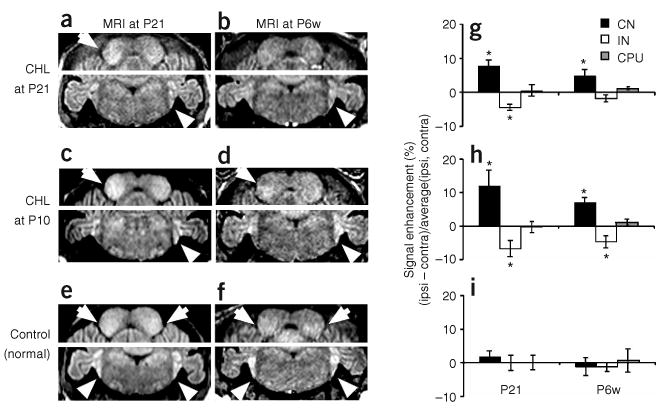
There are currently no noninvasive imaging methods available for auditory brain mapping in mice, despite the increasing use of genetically engineered mice to study auditory brain development and hearing loss. We developed a manganese-enhanced MRI (MEMRI) method to map regions of accumulated sound-evoked activity in awake, normally behaving mice. To demonstrate its utility for high-resolution (100-microm) brain mapping, we used MEMRI to show the tonotopic organization of the mouse inferior colliculus. To test its efficacy in an experimental setting, we acquired data from mice experiencing unilateral conductive hearing loss at different ages. Larger and persistent changes in auditory brainstem activity resulted when hearing loss occurred before the onset of hearing, showing that early hearing loss biases the response toward the functional ear. Thus, MEMRI provides a sensitive and effective method for mapping the mouse auditory brainstem and has great potential for a range of functional neuroimaging studies in normal and mutant mice.


Conflict of interest statement

COMPETING INTERESTS STATEMENT

The authors declare that they have no competing financial interests.

Figures

Figure 1
Figure 1
Mn-enhanced MRI (MEMRI) of the mouse brain under normal conditions. (a,b) Horizontal T1-weighted images of an adult mouse brain without Mn2+ (a) and 24 h after i.p. injection of MnCl2 (b) demonstrated contrast enhancement in a number of brain regions: Cb, cerebellum; Hi, hippocampus; IC, inferior colliculus; OB, olfactory bulb. The caudate putamen (CPu) was identified as a region with no obvious MEMRI enhancement.
Figure 2
Figure 2
Brain regions were analyzed from volumetric in vivo MRI data. (a) Using 3D MRI data (upper left) with 100-μm isotropic resolution, auditory nuclei and control regions were identified in coronal or horizontal cross-sections (100 μm thick) through each region (central panels), and ROIs were defined (open red triangles or circles) after comparing MRI with a reference mouse brain atlas (right: reprinted with permission from the Mouse Brain Library, http://www.mbl.org). Three representative slices are shown through each of the auditory brainstem nuclei (green: CN, cochlear nucleus; blue: IC, inferior colliculus) and a non-auditory control region (red: CPu, caudate putamen). The orientations of sections through each nucleus are also indicated on the schematic sagittal representation of the mouse brain (lower left). (b,c) Quantitative comparison of MEMRI signal between normal mice (n = 7) and bilateral CHL mice (n = 7) in ascending auditory nuclei (CN; IC; MGN, medial geniculate nucleus; AC, auditory cortex; b) and in non-auditory brain regions, including regions with (Cb, cerebellum; Hi, hippocampus; OB, olfactory bulb) and without (CPu) obvious enhancement (c). Regions with statistically significant MEMRI enhancement are marked with an asterisk (*).
Figure 3
Figure 3
MEMRI enhancement in brainstem auditory nuclei was altered in mice with CHL. (a–c) Comparisons of individual mice with bilateral CHL (bi-CHL; a), mice with unilateral CHL (uni-CHL; b) and normal mice (c) demonstrated marked differences in MEMRI signals in the CN (arrow heads) and IC (arrows), but not in non-auditory CPu. (d–f) Quantitative analysis was performed on MEMRI signals from normal mice (n = 7), mice with bilateral CHL (n = 7) and mice with uni-CHL (n = 6). Statistically significant MEMRI enhancement is marked with an asterisk (*). (g–j) Averaged histograms (n = 3) of MEMRI signal levels comparing normal mice and bilateral CHL mice (g,i) and comparing ipsilateral signals to contralateral signals in the CN and IC of unilateral CHL mice (h,j).
Figure 4
Figure 4
MEMRI was used to map the tonotopic organization of the mouse IC. (a) Sagittal (upper) and coronal (lower) images of the P21 IC showed obvious differences in mice exposed to defined stimuli. (b) After broadband (1–59 kHz) stimulation, enhancement covered most of the rostral-caudal (r-c), ventral-dorsal (v-d) extent of the central nucleus of the IC. (c) After high-frequency broadband (20–50 kHz) stimulation, enhancement was more restricted to the ventral-caudal region. (d) After 40 kHz pure-tone stimulation, enhancement was restricted to an isofrequency band in excellent agreement with electrophysiological maps (inset). (e) Averaged, co-registered images (n = 8) were used to extract whole-brain (gray) and IC (green) and to generate 3D maps of MEMRI IC enhancement (red) after stimulation with 1–59 kHz (f), 20–50 kHz (g) and 40 kHz (h). From these 3D maps we determined the spatial coordinates of the centroids of both the IC (yellow spheres) and the enhanced volumes (red spheres). Measurements of IC volume (i), IC-enhanced volume (j), and position (distance between IC centroid and enhanced volume centroid; k) were made in the three experimental groups. Statistical analysis showed significant differences in both the enhanced volumes and the centroid-centroid distances between each pair of groups (*).
Figure 5
Figure 5
MEMRI can be used for longitudinal imaging studies. Averaged sagittal (a) and coronal (b) images of the IC after injection of MnCl2 and 24 h of exposure to 20–50 kHz noise (left), after a subsequent 24 h with no defined stimulation (center), and after an additional injection of a half-dose of MnCl2 and exposure to the 40 kHz pure tone for 24 h (right). (c) Coronal maps encoded in color to make the enhancement patterns easier to see (color scale shown below).
Figure 6
Figure 6
MEMRI demonstrates differences in sound-evoked activity in mice experiencing CHL at distinct developmental stages. (a–d) Mice with unilateral CHL at P21 (a,b) and P10 (c,d) and imaged at P21 (a,c) and P6w (b,d). (e,f) Comparisons to normal (control) mice, imaged at P21 (e) or P6w (f). Enhancement in CN (arrowheads, lower panels) and IC (arrows, upper panels) is marked. (g–i) Quantitative analysis of the ipsilateral-contralateral signal differences for CN, IC and (control) CPu in mice experiencing unilateral CHL at P21 (n = 7; g), and P10 (n = 7; h), and in normal mice (n = 7; i). Statistically significant MEMRI enhancement is marked with an asterisk (*).

References

    1. Ogawa S, Lee TM, Kay AR, Tank DW. Brain magnetic resonance imaging with contrast dependent on blood oxygenation. Proc Natl Acad Sci USA. 1990;87:9868–9872. - PMC - PubMed
    1. Narita K, Kawasaki F, Kita H. Mn and Mg influxes through Ca channels of motor nerve terminals are prevented by vermapil in frogs. Brain Res. 1990;510:289–295. - PubMed
    1. Lin Y, Koretsky AP. Manganese ion enhanced T1-weighted MRI during brain activation: an approach to direct imaging of brain function. Magn Reson Med. 1997;38:378–388. - PubMed
    1. Duong TQ, Silva AC, Lee SP, Kim SG. Functional MRI of calcium-dependent synaptic activity: cross correlation with CBF and BOLD measurements. Magn Reson Med. 2000;43:383–392. - PubMed
    1. Aoki I, Naruse S, Tanaka C. Manganese-enhanced magnetic resonance imaging (MEMRI) of brain activity and applications to early detection of brain ischemia. NMR Biomed. 2004;17:569–580. - PubMed

Publication types

LinkOut - more resources