. 2005 Jul;6(7):707-14.
doi: 10.1038/ni1210. Epub 2005 May 29.

Stable T cell-dendritic cell interactions precede the development of both tolerance and immunity in vivo

Affiliations

Stable T cell-dendritic cell interactions precede the development of both tolerance and immunity in vivo

Guy Shakhar et al. Nat Immunol. 2005 Jul.

Abstract

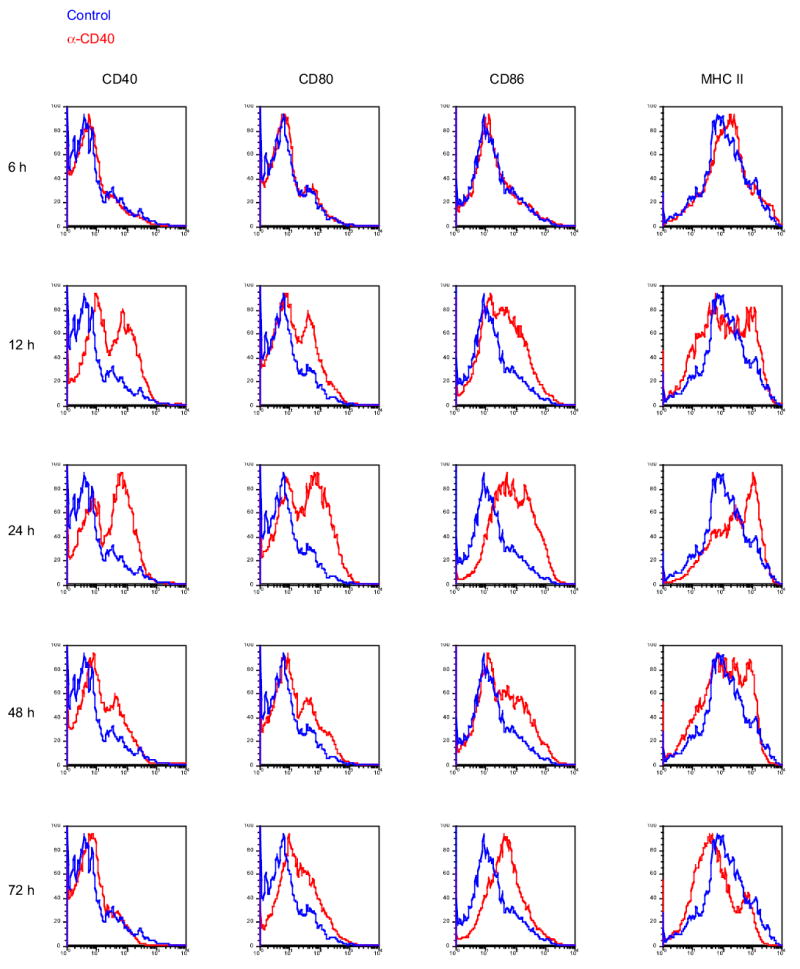
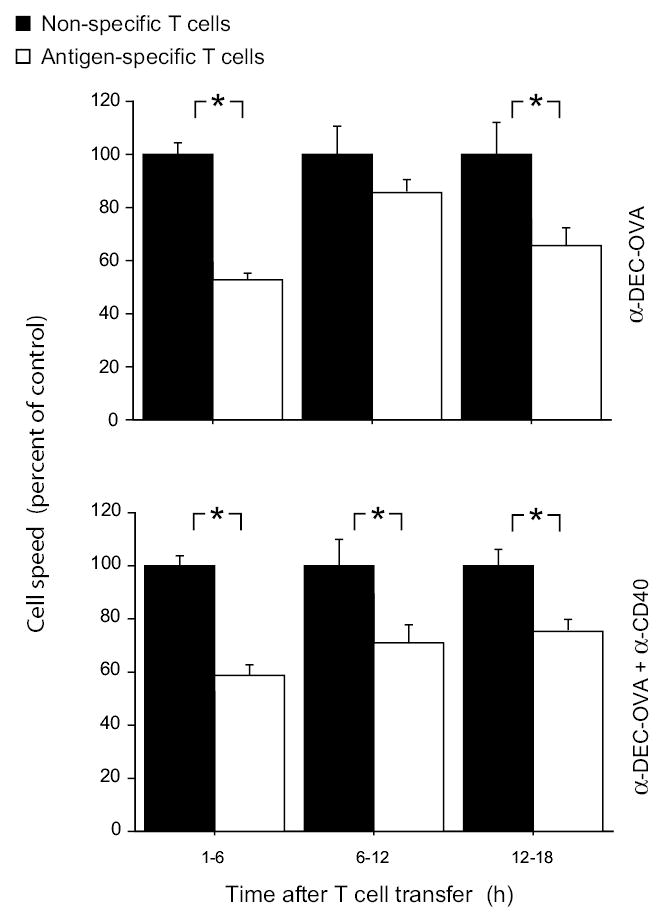
The maturation status of dendritic cells (DCs) determines whether they prime or tolerize T cells. We targeted ovalbumin peptide exclusively to DCs in situ using an antibody to DEC-205 and studied the interaction of DCs with naive CD4(+) T cells in tolerizing or priming conditions. We used two-photon microscopy to simultaneously track antigen-specific OT-II T cells, nonspecific T cells and DCs in lymph nodes of living mice. In both tolerance and immunity, OT-II cells arrested on DCs near high endothelial venules beginning shortly after extravasation and regained their baseline speed by 18 h. Thus, early antigen-dependent T cell arrest on DCs is a shared feature of tolerance and priming associated with activation and proliferation.


Conflict of interest statement

Competing interests statement The authors declare that they have no competing financial interests.

Figures

Figure 1
Figure 1
OT-II T cell activation and tolerance induced by α-DEC-OVA. Transferred OT-II T cells (CD45.2) divide in response to antigen presented by DCs in vivo by day 3 and are deleted in the absence of α-CD40 by day 7. (a) Similar activation of OT-II T cells after delivery of α-DEC-OVA with and without α-CD40. Histograms show surface expression of the indicated marker gated on CD45.2+ TCR Vα2+ cells 3, 12, and 24 h after challenge (see Methods). (b) Plots show CFSE dye dilution of gated populations of CD4+ CD45.2+ T cells 3 and 7 days after challenge with 2 μg of α-DEC-OVA with or without α-CD40 or with PBS. Percentages of CFSEhi/lo TCR Vα2+ cells out of CD4+ T cells are indicated. (c) Numbers of surviving OT-II cells 3 or 7 days after challenge as in b; percentages of CD45.2+ TCR Vα2+ cells among CD4+ T cells are indicated. Antigen-specific T cells were deleted unless CD40 was engaged. (d) OT-II cells are only transiently activated by in vivo delivery of α-DEC-OVA to DCs. CD4+ cells were purified from peripheral lymph nodes 3 or 7 days after challenge as in b and cultured with irradiated CD11c+ cells in the presence or absence of OVA peptide; proliferation index denotes the ratio of thymidine incorporation in antigen-challenged to unchallenged cells, corrected for background proliferation. Data are representative of 3 to 4 experiments.
Figure 2
Figure 2
During early stages of priming and tolerance, antigen-specific T cells are located closer to HEVs in the superficial paracortex than non-specific T cells. (a) Confocal micrographs of lymph node frozen sections immunostained for MECA-79 (red) and B220 (blue); EGFP fluorescence from transferred T cells (green) was visualized directly. EGFP-expressing OT-II or non-TCR transgenic T cells were transferred into C57BL/6 mice five h after injection of α-DEC-OVA with or without α-CD40. Insets show high-magnification view of T cells near HEVs. (left panels) or in the deep paracortex (right panels); the deep paracortex is outlined in yellow. Optical sections were 1.2 μm in both MECA-79 and B220 channels and 5 mm in the EGFP channel. (b) The percentage of T cells in the deep paracortex was calculated as described previously. Three h after cell transfer, there were more non-specific T cells found in the deep paracortex than antigen-specific T cells; at 24 h after cell transfer, specific and non-specific T cells were more equally represented in the deep paracortex. (c) The distance from T cells to the nearest HEV. Three h after cell transfer, antigen-specific cells were closer than non-specific cells to HEVs. (d) Two-photon visualization of specific and non-specific T cells near an HEV in the inguinal lymph node of an anesthetized mouse. Error bars denote standard error of the mean. Asterisks indicate significant differences; see text for p values. Data are representative of 3 experiments.
Figure 3
Figure 3
Tracking of specific and non-specific T cells in the lymph nodes of living mice. Representative tracks of EGFP-OT-II T cells and ECFP-T cells. Antigen-specific EGFP-OT-II cells and non-specific ECFP-T cells were tracked throughout the imaged volume for the duration of imaging, and the XY projection of their tracks is displayed. Data representative of a total of 62 imaging fields analyzed.
Figure 4
Figure 4
Mean cell velocities in tolerizing and priming conditions. Mice were injected with antibodies and T cells, inguinal lymph nodes were imaged, and specific and non-specific T cells were tracked as above. Antigen-specific EGFP-OT-II cells move slowly at 1–5 h in both priming (mean cell velocity 5.2 μm/min) and tolerance (4.4 μm/min), while non-specific T cells maintain their normal velocity of ~9 μm/min. Error bars denote standard error of the mean. Asterisks indicate significant differences; see text for p values. Plot summarizes collective data from all experiments.
Figure 5
Figure 5
Early T cell arrest in tolerizing and priming conditions. (a) Percent of immobile cells in priming and tolerance. More antigen-specific EGFP-OT-II cells than non-specific T cells are immobile (mean velocity <2 μm/min) at 1–6 h in both priming and tolerance. (b) Arrest coefficient of specific and non-specific T cells. The arrest coefficient is the percentage of each track that a cell is immobile (instantaneous velocity <2 μm/min). In both priming and tolerance, from 1–6 h after T cell transfer, EGFP-OT-II cells are arrested for an average of 40–50% of each track, as compared to 20% for non-specific T cells. Error bars denote standard error of the mean. Asterisks indicate significant differences; see text for p values. Graphs summarize collective data from all experiments.
Figure 6
Figure 6
Directionality of specific and non-specific T cells. (a) Turning angle of specific and non-specific T cells. Lower turning angles indicate more linear cell movement. (b) Confinement index of specific and non-specific T cells. Confinement index is the ratio of the maximum cell displacement to the path length; a higher confinement index indicates more linear movement. At time points when antigen-specific cells move more slowly than non-specific cells, the non-specific cells move more linearly by both measures of directionality. Graphs summarize collective data from all experiments. Error bars denote standard error of the mean. Asterisks indicate significant differences; see text for p values.
Supplementary Figure 1
DC maturation induced by α-CD40 antibody. Mice were injected i.p. with 50 μg α-CD40, lymph nodes were harvested at the indicated times, and CD11c+ DCs were isolated by immunomagnetic selection and analyzed by flow cytometry. Histograms show the indicated surface marker, gated on CD11c+ CD3 CD19 cells. Data representative of 2 separate experiments.
Supplementary Figure 2
Timeline for imaging T cell tolerance and priming. CD11c-EYFP mice were injected with α-DEC-OVA with or without α-CD40 5 h prior to transfer of EGFP-OT-II cells and wild-type ECFP-T cells; inguinal lymph nodes were imaged intravitally at the indicated periods.
Supplementary Figure 3
There is no systematic association between cell depth and average cell speed. The depth of each cell was calculated from its depth in the imaging field and the depth of the imaging field below the lymph node capsule. Plot summarizes collective data from all experiments.
Supplementary Figure 4
Instantaneous velocities of specific and non-specific cells. Results are similar to those obtained for mean cell velocity. Histogram summarizes collective data from all experiments. Error bars denote standard error of the mean. Asterisks indicate significant differences.
Supplementary Figure 5
Speeds of antigen-specific cells normalized to speed of control cells in the same imaging field. Cells were transferred, imaged, and tracked as above, and the median speed of the non-specific cells was determined for each imaging field; fields with fewer than three non-specific cells were excluded. Antigen-specific cell speeds were expressed as a percentage of the median non-specific speed in the same field. Chart summarizes collective data from all experiments. Results are similar to those obtained for mean cell velocity.

References

    1. Stoll S, Delon J, Brotz TM, Germain RN. Dynamic imaging of T cell-dendritic cell interactions in lymph nodes. Science. 2002;296:1873–6. - PubMed
    1. Miller MJ, Wei SH, Parker I, Cahalan MD. Two-Photon Imaging of Lymphocyte Motility and Antigen Response in Intact Lymph Node. Science. 2002;296:1869–1873. - PubMed
    1. Bousso P, Robey E. Dynamics of CD8+ T cell priming by dendritic cells in intact lymph nodes. Nat Immunol. 2003;4:579–85. - PubMed
    1. Miller MJ, Hejazi AS, Wei SH, Cahalan MD, Parker I. T cell repertoire scanning is promoted by dynamic dendritic cell behavior and random T cell motility in the lymph node. Proc Natl Acad Sci U S A. 2004;101:998–1003. - PMC - PubMed
    1. Miller MJ, Safrina O, Parker I, Cahalan MD. Imaging the Single Cell Dynamics of CD4+ T Cell Activation by Dendritic Cells in Lymph Nodes. J Exp Med. 2004;200:847–56. - PMC - PubMed

Publication types

MeSH terms