. 2005 Jun 2;46(5):787-98.
doi: 10.1016/j.neuron.2005.04.035.

Behavioral correlates of activity in identified hypocretin/orexin neurons

Affiliations

Behavioral correlates of activity in identified hypocretin/orexin neurons

Boris Y Mileykovskiy et al. Neuron. .

Abstract

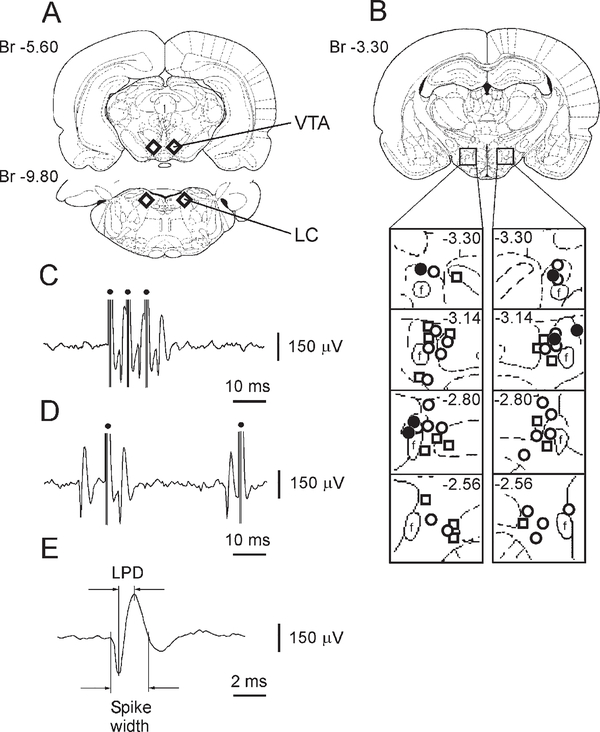
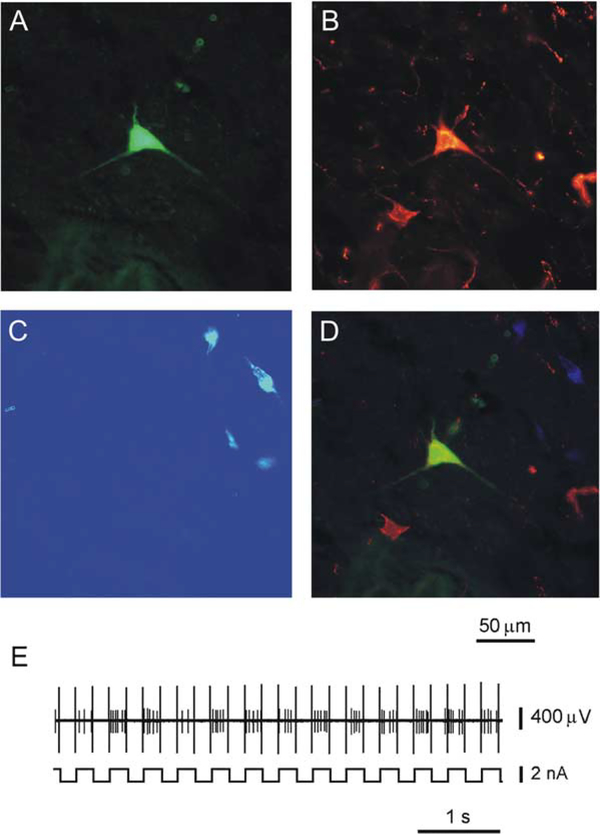
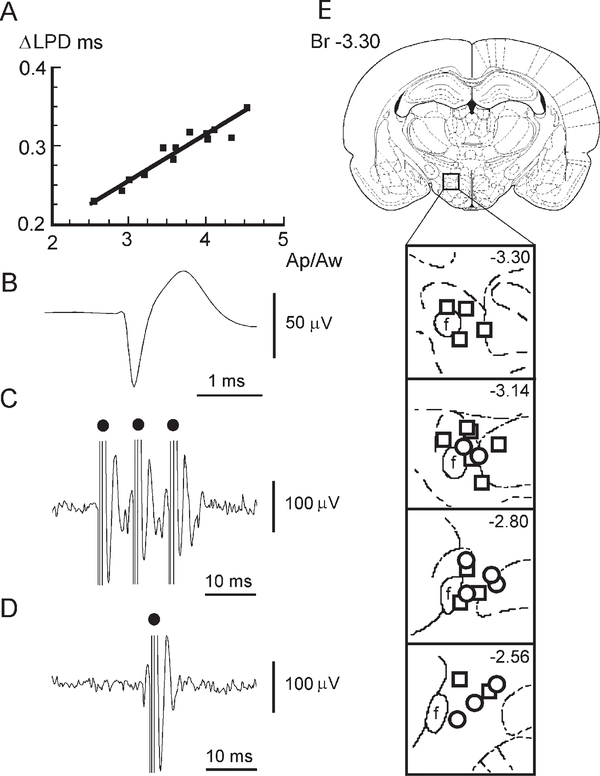
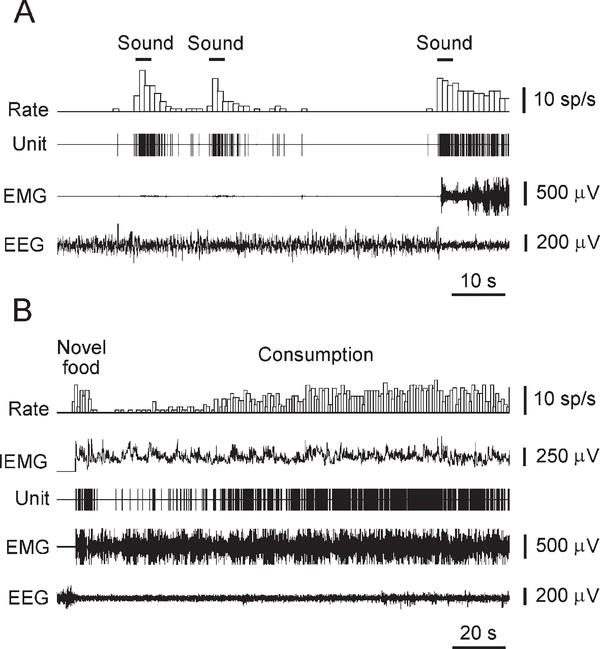
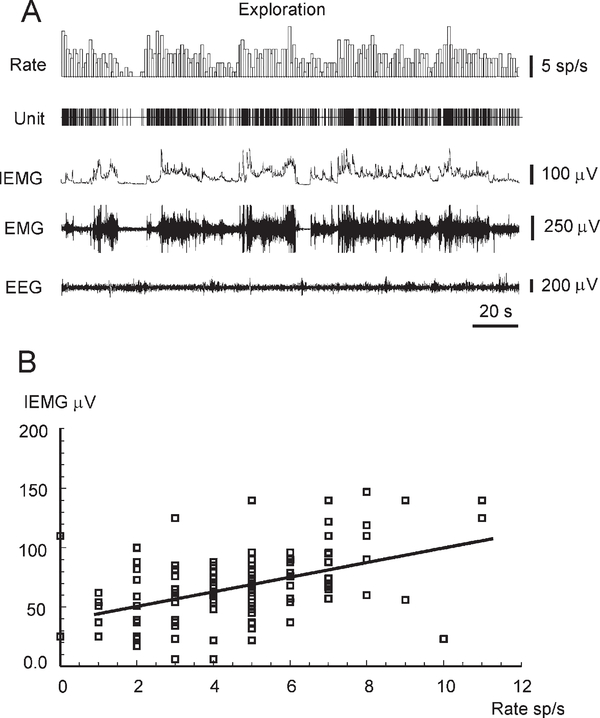
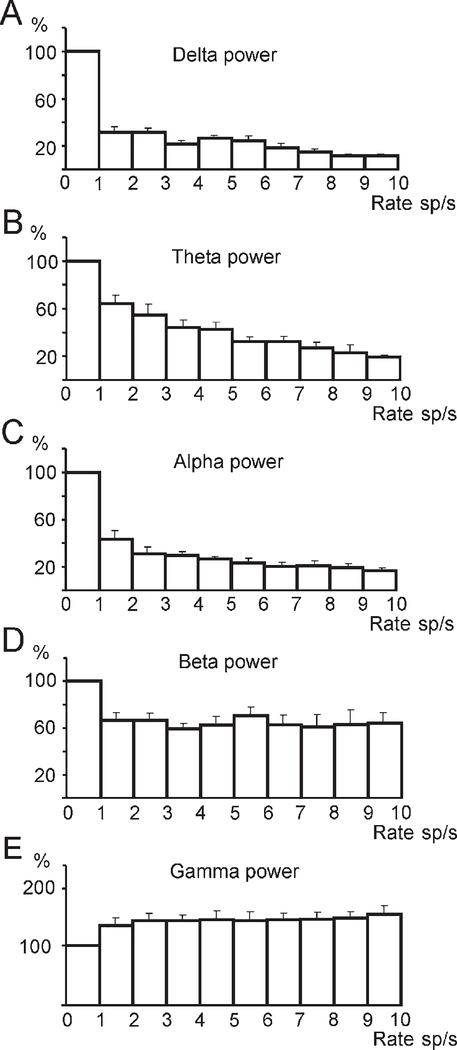
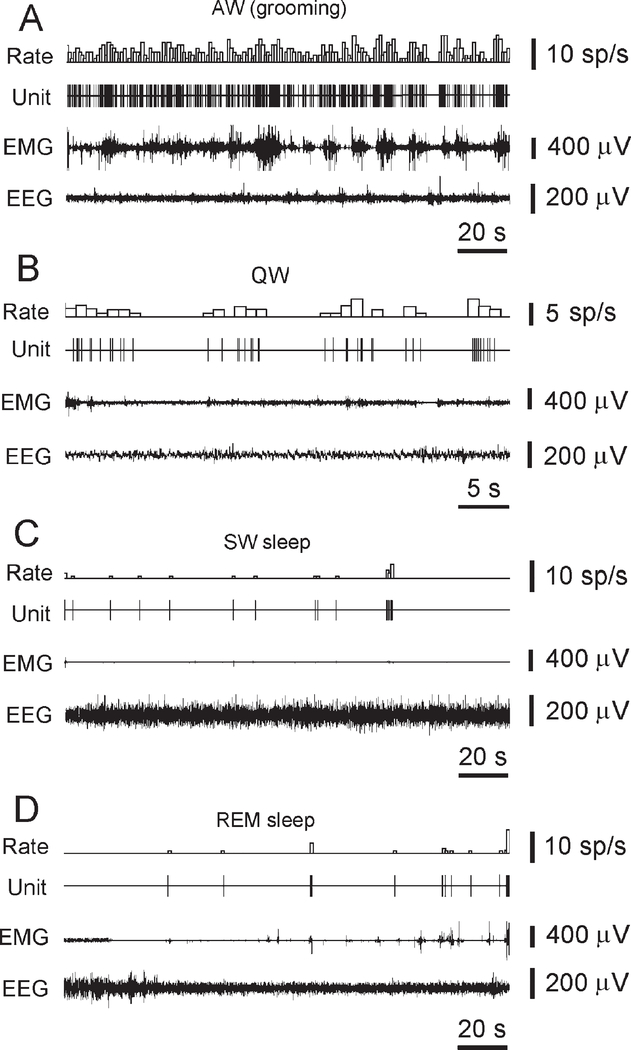
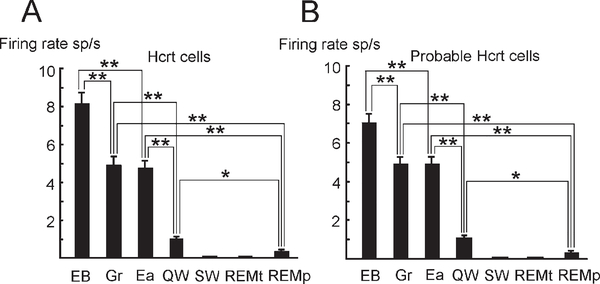
Micropipette recording with juxtacellular Neurobiotin ejection, linked micropipette-microwire recording, and antidromic and orthodromic activation from the ventral tegmental area and locus coeruleus were used to identify hypocretin (Hcrt) cells in anesthetized rats and develop criteria for identification of these cells in unanesthetized, unrestrained animals. We found that Hcrt cells have broad action potentials with elongated later positive deflections that distinguish them from adjacent antidromically identified cells. They are relatively inactive in quiet waking but are transiently activated during sensory stimulation. Hcrt cells are silent in slow wave sleep and tonic periods of REM sleep, with occasional burst discharge in phasic REM. Hcrt cells discharge in active waking and have moderate and approximately equal levels of activity during grooming and eating and maximal activity during exploratory behavior. Our findings suggest that these cells are activated during emotional and sensorimotor conditions similar to those that trigger cataplexy in narcoleptic animals.


Figures

Figure 1.
Figure 1.. The Location of Stimulated VTA and LC Sites and Characteristics of Antidromically and Orthodromically Identified Hcrt Neurons Recorded in Urethane-Anesthetized Rats
(A) Schematic drawing of stimulated VTA and LC regions (diamonds) that induced antidromic and orthodromic responses in Hcrt neurons. (B) The location of Hcrt neurons that responded antidromically (open circles) and orthodromically (open squares) to VTA stimulation as well as Hcrt cells antidromically driven by LC stimulation (closed circles). (C) Antidromic spikes of Hcrt neuron to electrical train stimulation of the VTA. (D) Collision of orthodromic and antidromic spikes in axon of an Hcrt neuron. (E) Spike of Hcrt neuron recorded with micropipette. f, fornix. Dots, stimulating pulses.
Figure 2.
Figure 2.
Immunohistochemical Identification of an Hcrt Neuron that Responded Antidromically to VTA Electrical Stimulation (A) Neuron labeled juxtacellularly for 5 min with 4% Nb dissolved in 0.5 M CH3COOK. (B) This neuron expresses immunoreactivity for Hcrt. (C) This neuron does not show immunoreactivity for MCH. (D) Merged composite of (A) and (B). (E) Juxtacellular labeling of Hcrt neuron with current pulses of two nA (200 ms on/200 ms off).
Figure 3.
Figure 3.
Comparison of LPD Recorded with Micropipettes and Microwires in Antidromically Identified Hcrt Cells and Their Spike Characteristics (A) Correlation between the difference of LPD (ΔLPD) and amplitude ratio (Ap/Aw) of spikes recorded with micropipette and microwire in anesthetized rats is expressed by linear regression: ΔLPD (ms) = 0.0892 + 0.0558 Ap/Aw; correlation coefficient r = 0.94 (F = 78.2; p < 0.0001; df = 1,11). (B) An averaged spike waveform of an Hcrt neuron recorded with microwires in the freely moving rat. (C) Antidromic spikes of Hcrt neuron to VTA train electrical stimulation in freely moving rat. (D) Collision of orthodromic and antidromic spikes in axon of Hcrt neuron. (E) The location of Hcrt (circles) and probable Hcrt (squares) neurons in the PFH and medial LH. Dots, stimulating pulses.
Figure 4.
Figure 4.
Responses of an Hcrt Neuron to Natural External Stimuli (A) Sound stimuli induce short-lasting Hcrt cell excitation independently of marked neck muscle activation. (B) Transient decrease of Hcrt cell activity in response to presentation of novel food (chicken). During decrease of firing rate, rat sniffed, tasted, and backed away from food. Hcrt cell firing accelerated in conjunction with onset of consumption. EMG, neck muscle electromyogram. EEG, electroencephalogram.
Figure 5.
Figure 5.
Example of the Correlation between the Firing Rate of an Hcrt Neuron and the Amplitude of the Neck EMG during Exploratory Behavior (A) The alteration of Hcrt cell firing rate, neck EMG, integrated neck EMG (IEMG), and EEG during exploratory behavior of freely moving rat. (B) Correlation between Hcrt cell firing rate and the amplitude of the neck IEMG during exploratory behavior is expressed by a linear regression: IEMG (μV) = 39.31 + 6.15 rate (spikes/s); correlation coefficient r = 0.48 (F = 39.8; p < 0.0001; df = 1, 133). See abbreviations in Figure 4.
Figure 6.
Figure 6.
The Alteration of EEG Spectral Power in the Delta, Theta, Alpha, Beta, and Gamma Frequency Bands during Periods of Increased Firing of Hcrt Neurons (A–C) The decrease of EEG powers in the delta, theta, and alpha frequency bands. Correlation coefficients for exponential regression models: r = −0.69, F = 23.1; r = −0.7, F = 43.7; r = −0.65, F = 19.6; p < 0.0001; df = 1, 65, respectively. (D) Weak correlation between discharge rate of Hcrt neurons and EEG power in beta frequency band (r = −0.29; F = 5.92; p < 0.05; df = 1, 65). (E) The increase of EEG power in gamma frequency band (r = 0.65; F = 53.8; p < 0.0001; df = 1,65). Figure is based on the analysis of data from nine Hcrt cells. Error bars indicate SEM.
Figure 7.
Figure 7.
The Discharge Pattern of a Representative Hcrt Neuron across the S-W Cycle in the Freely Moving Rat (A) High firing rates are seen during AW (grooming). (B) Reduced firing rate or cessation of activity is seen in QW and drowsiness. (C) A further decrease or cessation of firing is seen during SW sleep. (D) Minimal firing rate is seen during the tonic phase of REM sleep. Brief Hcrt cell discharge bursts are correlated with muscle twitches during the phasic events of REM sleep.
Figure 8.
Figure 8.
Firing Rate of Hcrt and Probable Hcrt Cells in Waking and Sleep Behaviors in Freely Moving Rats Exploratory behavior (EB), grooming (Gr), eating (Ea), QW, SW sleep (SW), and tonic (REMt) and phasic (REMp) sleep. Maximal discharge is seen during exploration-approach behavior. (A) Discharge pattern of Hcrt neurons (n = 9). (B) Discharge pattern of probable Hcrt neurons (n = 15) orthodromically excited by VTA stimulation. Bonferroni t test, *p < 0.05, **p < 0.01. Error bars indicate SEM.

Comment in

References

    1. Acuna-Goycolea C, Li Y, and van den Pol AN (2004). Group III metabotropic glutamate receptors maintain tonic inhibition of excitatory synaptic input to hypocretin/orexin neurons. J. Neurosci. 24, 3013–3022. - PMC - PubMed
    1. Alam MN, Gong H, Alam T, Jaganath R, McGinty D, and Szymusiak R (2002). Sleep-waking discharge patterns of neurons recorded in the rat perifornical lateral hypothalamic area. J. Physiol. 538, 619–631. - PMC - PubMed
    1. Aston-Jones G, Chiang C, and Alexinsky T (1991). Discharge of noradrenergic locus coeruleus neurons in behaving rats and monkeys suggests a role in vigilance. Prog. Brain Res. 88, 501–520. - PubMed
    1. Aston-Jones G, Rajkowski J, Kubiak P, and Alexinsky T (1994). Locus coeruleus neurons in monkey are selectively activated by attended cues in a vigilance task. J. Neurosci. 14, 4467–4480. - PMC - PubMed
    1. Aston-Jones G, Chen S, Zhu Y, and Oshinsky ML (2001). A neural circuit for circadian regulation of arousal. Nat. Neurosci. 4, 732–738. - PubMed

Publication types