. 2005 May 31:6:132.
doi: 10.1186/1471-2105-6-132.

Generating quantitative models describing the sequence specificity of biological processes with the stabilized matrix method

Affiliations

Generating quantitative models describing the sequence specificity of biological processes with the stabilized matrix method

Bjoern Peters et al. BMC Bioinformatics. .

Abstract

Background: Many processes in molecular biology involve the recognition of short sequences of nucleic-or amino acids, such as the binding of immunogenic peptides to major histocompatibility complex (MHC) molecules. From experimental data, a model of the sequence specificity of these processes can be constructed, such as a sequence motif, a scoring matrix or an artificial neural network. The purpose of these models is two-fold. First, they can provide a summary of experimental results, allowing for a deeper understanding of the mechanisms involved in sequence recognition. Second, such models can be used to predict the experimental outcome for yet untested sequences. In the past we reported the development of a method to generate such models called the Stabilized Matrix Method (SMM). This method has been successfully applied to predicting peptide binding to MHC molecules, peptide transport by the transporter associated with antigen presentation (TAP) and proteasomal cleavage of protein sequences.

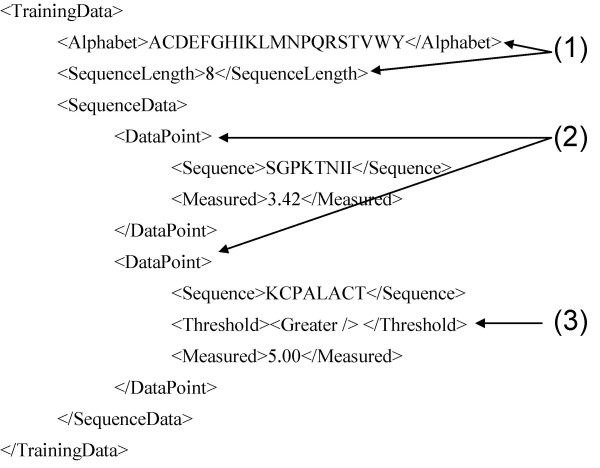
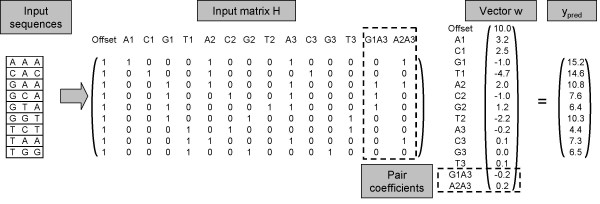
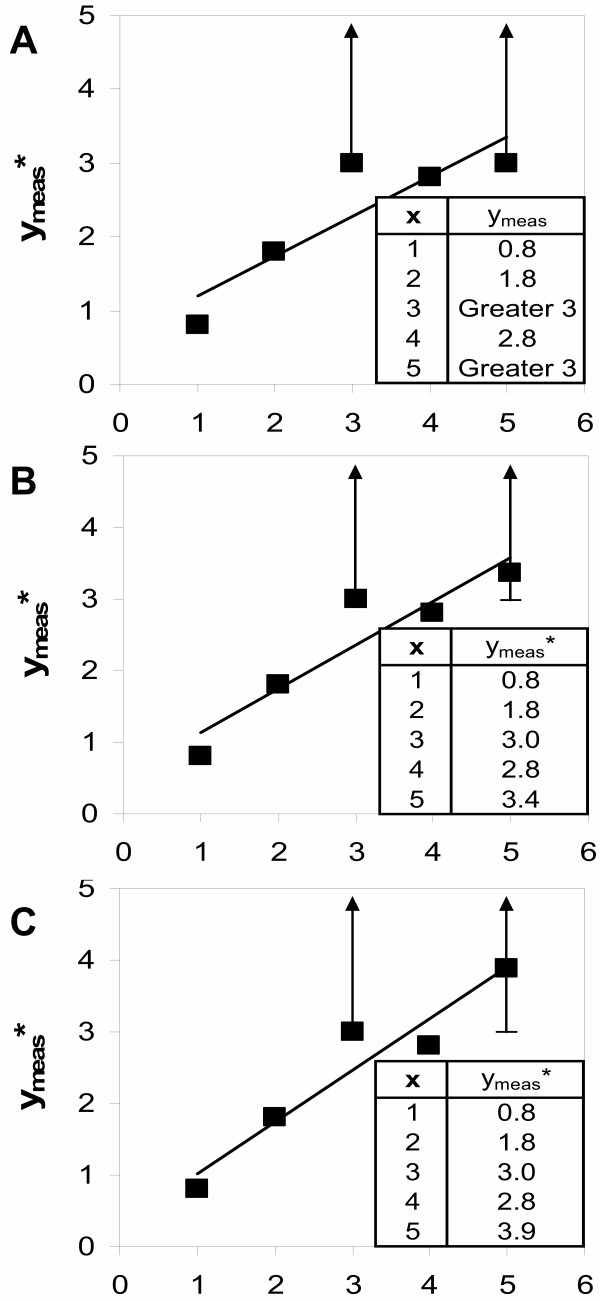
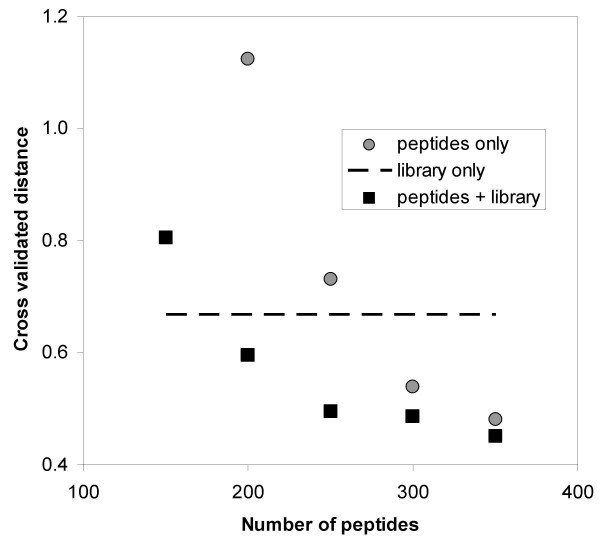
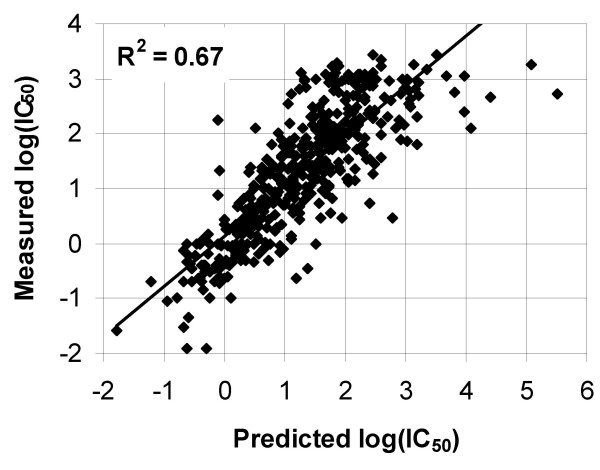
Results: Herein we report the implementation of the SMM algorithm as a publicly available software package. Specific features determining the type of problems the method is most appropriate for are discussed. Advantageous features of the package are: (1) the output generated is easy to interpret, (2) input and output are both quantitative, (3) specific computational strategies to handle experimental noise are built in, (4) the algorithm is designed to effectively handle bounded experimental data, (5) experimental data from randomized peptide libraries and conventional peptides can easily be combined, and (6) it is possible to incorporate pair interactions between positions of a sequence.

Conclusion: Making the SMM method publicly available enables bioinformaticians and experimental biologists to easily access it, to compare its performance to other prediction methods, and to extend it to other applications.


Figures

Figure 1
Figure 1
Input training data. The <TrainingData> element consists of a series of <DataPoints> (2). Each contains a sequence and a measurement value. The characters allowed in <Sequence> are specified in <Alphabet> (1), and the number of characters has to correspond to <SequenceLength> (1). In this example, <Alphabet> and <SequenceLength> specify 8-mer peptides in single letter amino acid code. Each measurement can optionally be associated with a threshold (3) that can either be <Greater> or <Lesser>, signaling that the measurement corresponds to an upper or lower boundary of measurable values.
Figure 2
Figure 2
Converting sequences into matrices. Input sequences of three nucleic acids each are converted to rows of a matrix H. The first column of each row is set to 1, which serves as a constant offset added to each prediction. Columns A1 to T1 contain a binary representation of the first residue in the sequence, in which all columns are set to zero except the one corresponding to the residue. The same is repeated for the second and third residue in the sequence in columns A2 to T2 and A3 to T3. The two last columns G1A3 and A2A3 contain pair coefficients explained at the end of the results section. They are set to one if the two specified residues are present in the input sequence at the two specified positions and zero otherwise. Multiplying matrix H with the weight vector w results in a vector ypred of predicted values for the sequences. Rows A1 to T3 of vector w are commonly written as a 'scoring matrix' which quantifies the contribution of each possible residue at each position to the prediction. Rows G1A3 and A2A3 of vector w quantify the impact of the pair coefficients.
Figure 3
Figure 3
Sequence position dependent regularization. Example for the regularization term tw Λ w in equation (2). The weight vector w corresponds to a scoring matrix for three nucleic acids as in Figure 2, but without pair coefficients. The diagonal matrix Λ has three different values Λ1, Λ2 and Λ3 effecting values in vector w corresponding to sequence positions 1, 2 and 3. There is no regularization penalty on the 'Offset' value.
Figure 4
Figure 4
Iterative model fitting using the L2<> norm. In this example, the model is a linear function which is fitted to a set of paired values (x, ymeas). For two of the x values (x = 3 and x = 5), the measured values are thresholds (Greater 3). Fitting a linear function to paired values according to the L2 norm corresponds to the standard linear regression. A depicts the model fit (straight line) to the measured values (black boxes), ignoring any thresholds. For x = 5, the model value ypred taken from the regression curve is 3.4, above the measured threshold value 3. Therefore, in the next iteration the ymeas* value is set to the model value 3.4. B shows the new linear regression with the adjusted ymeas* values. This procedure is repeated until the ymeas* values no longer change (8 iterations, panel C).
Figure 5
Figure 5
Combining peptide and library data improves prediction quality. A set of 449 9-mer peptides with measured affinities for TAP taken from [20] was split into 5 blind sets. For each of these blind sets, predictions where made from different size subsets of the remaining peptides. The x-axis depicts the number of peptides in these subsets used for generating predictions using either the peptides alone (circles) or in combination with data from a combinatorial peptide library (squares). The dashed line displays the prediction of the library alone, which was taken from [15]. The y-axis depicts the L2<> distance of the predictions for the combined 5 blind sets.
Figure 6
Figure 6
Visualization of prediction quality. Scatter plot of predicted vs. measured affinity for peptide binding to TAP. The depicted prediction corresponds to the data point in figure 5 with the lowest cross-validated distance, in which 350 peptides and the peptide library were used for training.

References

    1. Peters B, Tong W, Sidney J, Sette A, Weng Z. Examining the independent binding assumption for binding of peptide epitopes to MHC-I molecules. Bioinformatics. 2003;19:1765–1772. doi: 10.1093/bioinformatics/btg247. - DOI - PubMed
    1. Peters B, Bulik S, Tampe R, Van Endert PM, Holzhutter HG. Identifying MHC class I epitopes by predicting the TAP transport efficiency of epitope precursors. J Immunol. 2003;171:1741–1749. - PubMed
    1. Tenzer S, Peters B, Bulik S, Schoor O, Lemmel C, Schatz MM, Kloetzel PM, Rammensee HG, Schild H, Holzhutter HG. Modeling the MHC class I pathway by combining predictions of proteasomal cleavage,TAP transport and MHC class I binding. Cell Mol Life Sci. 2005;62:1025–1037. doi: 10.1007/s00018-005-4528-2. - DOI - PMC - PubMed
    1. Thomason L. TinyXml http://sourceforge.net/projects/tinyxml/
    1. Gnu Scientific Library (GSL) http://www.gnu.org/software/gsl/

Publication types