Finger extensor variability in TMS parameters among chronic stroke patients
- PMID: 15927075
- PMCID: PMC1175099
- DOI: 10.1186/1743-0003-2-10
Finger extensor variability in TMS parameters among chronic stroke patients
Abstract
Background: This study determined the reliability of topographic motor cortical maps and MEP characteristics in the extensor digitorum communis (EDC) evoked by single-pulse TMS among patients with chronic stroke.
Methods: Each of ten patients was studied on three occasions. Measures included location of the EDC hotspot and center of gravity (COG), threshold of activation and average amplitude of the hotspot, number of active sites, map volume, and recruitment curve (RC) slope.
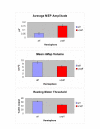
Results: Consistent intrahemispheric measurements were obtained for the three TMS mapping sessions for all measured variables. No statistically significant difference was observed between hemispheres for the number of active sites, COG distance or the RC slope. The magnitude and range of COG movement between sessions were similar to those reported previously with this muscle in able-bodied individuals. The average COG movement over three sessions in both hemispheres was 0.90 cm. The average COG movement in the affected hemisphere was 1.13 (+/- 0.08) cm, and 0.68 (+/- 0.04) cm) for the less affected hemisphere. However, significant interhemispheric variability was seen for the average MEP amplitude, normalized map volume, and resting motor threshold.
Conclusion: The physiologic variability in some TMS measurements of EDC suggest that interpretation of TMS mapping data derived from hemiparetic patients in the chronic stage following stroke should be undertaken cautiously. Irrespective of the muscle, potential causes of variability should be resolved to accurately assess the impact of pharmacological or physical interventions on cortical organization as measured by TMS among patients with stroke.
Figures


Similar articles
-
Intra-subject reliability of parameters contributing to maps generated by transcranial magnetic stimulation in able-bodied adults.Clin Neurophysiol. 2004 Aug;115(8):1740-7. doi: 10.1016/j.clinph.2004.02.027. Clin Neurophysiol. 2004. PMID: 15261852
-
Low frequency repetitive transcranial magnetic stimulation to the non-lesioned hemisphere improves paretic arm reach-to-grasp performance after chronic stroke.Disabil Rehabil Assist Technol. 2013 Mar;8(2):121-4. doi: 10.3109/17483107.2012.737136. Epub 2012 Dec 17. Disabil Rehabil Assist Technol. 2013. PMID: 23244391
-
TMS brain mapping of the pharyngeal cortical representation in healthy subjects.Brain Stimul. 2020 May-Jun;13(3):891-899. doi: 10.1016/j.brs.2020.02.031. Epub 2020 Mar 4. Brain Stimul. 2020. PMID: 32289722
-
Reliability of active robotic neuro-navigated transcranial magnetic stimulation motor maps.Exp Brain Res. 2023 Feb;241(2):355-364. doi: 10.1007/s00221-022-06523-3. Epub 2022 Dec 16. Exp Brain Res. 2023. PMID: 36525072
-
Integrated technology for evaluation of brain function and neural plasticity.Phys Med Rehabil Clin N Am. 2004 Feb;15(1):263-306. doi: 10.1016/s1047-9651(03)00124-4. Phys Med Rehabil Clin N Am. 2004. PMID: 15029909 Review.
Cited by
-
Motor skill changes and neurophysiologic adaptation to recovery-oriented virtual rehabilitation of hand function in a person with subacute stroke: a case study.Disabil Rehabil. 2017 Jul;39(15):1524-1531. doi: 10.1080/09638288.2016.1226421. Epub 2016 Sep 27. Disabil Rehabil. 2017. PMID: 27669997 Free PMC article.
-
The Effects of Mirror Feedback during Target Directed Movements on Ipsilateral Corticospinal Excitability.Front Hum Neurosci. 2017 May 11;11:242. doi: 10.3389/fnhum.2017.00242. eCollection 2017. Front Hum Neurosci. 2017. PMID: 28553218 Free PMC article.
-
It takes two: noninvasive brain stimulation combined with neurorehabilitation.Arch Phys Med Rehabil. 2015 Apr;96(4 Suppl):S89-93. doi: 10.1016/j.apmr.2014.09.019. Arch Phys Med Rehabil. 2015. PMID: 25813373 Free PMC article.
-
Functional Strength Training and Movement Performance Therapy for Upper Limb Recovery Early Poststroke-Efficacy, Neural Correlates, Predictive Markers, and Cost-Effectiveness: FAST-INdiCATE Trial.Front Neurol. 2018 Jan 25;8:733. doi: 10.3389/fneur.2017.00733. eCollection 2017. Front Neurol. 2018. PMID: 29472884 Free PMC article.
-
The Association Between Reorganization of Bilateral M1 Topography and Function in Response to Early Intensive Hand Focused Upper Limb Rehabilitation Following Stroke Is Dependent on Ipsilesional Corticospinal Tract Integrity.Front Neurol. 2019 Mar 26;10:258. doi: 10.3389/fneur.2019.00258. eCollection 2019. Front Neurol. 2019. PMID: 30972004 Free PMC article.
References
-
- Barker AT. The history and basic principles of magnetic nerve stimulation. In: Paulus W, Hallet M, Rossini P, Rothwell J, editor. Transcranial magnetic stimulation. Vol. 51. New York: Elsevier Science; 1999. pp. 3–18.
-
- Beric A. Transcranial electrical and magnetic stimulation. In: Devinsky O, Beric A, Dogali M, editor. Electrical and magnetic stimulation of the brain and spinal cord Advances in Neurology. Vol. 63. New York: Raven Press; 1993. pp. 29–42. - PubMed
-
- Wassermann EM. Risk and safety of repetitive transcranial magnetic stimulation: report and suggested guidelines from the International Workshop on the Safety of Repetitive Transcranial Magnetic Stimulation, June 5–7, 1996. Electroencephalogr & Clin Neurophysiol. 1998;108:1–16. doi: 10.1016/S0168-5597(97)00096-8. - DOI - PubMed
LinkOut - more resources
Full Text Sources

