. 2005 Jun 7;102(23):8204-9.
doi: 10.1073/pnas.0502857102. Epub 2005 May 31.

The coordinate regulation of the p53 and mTOR pathways in cells

Affiliations

The coordinate regulation of the p53 and mTOR pathways in cells

Zhaohui Feng et al. Proc Natl Acad Sci U S A. .

Abstract

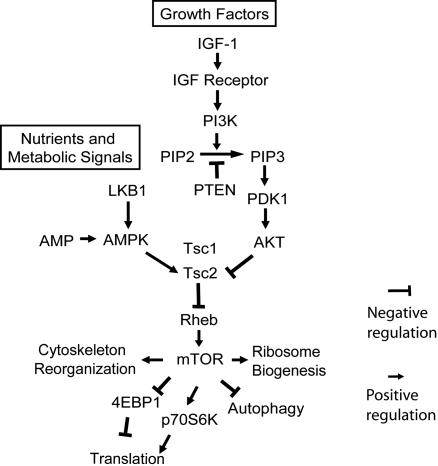
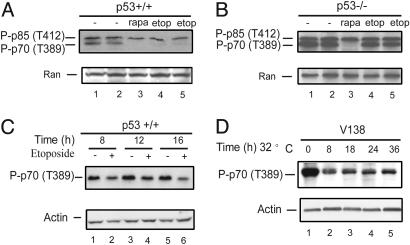
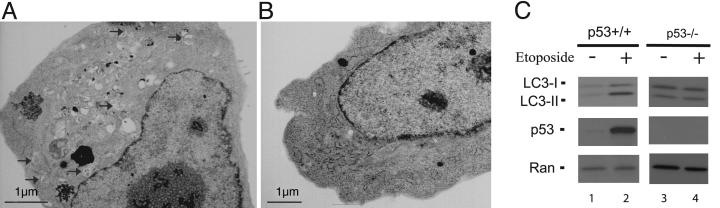
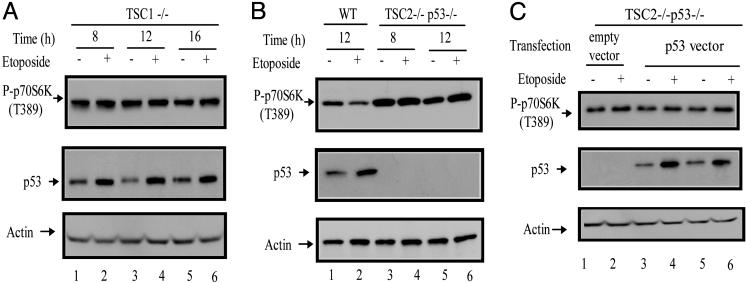
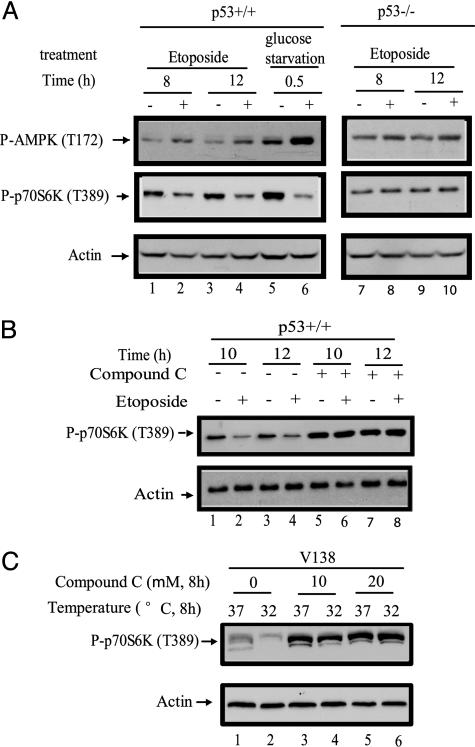
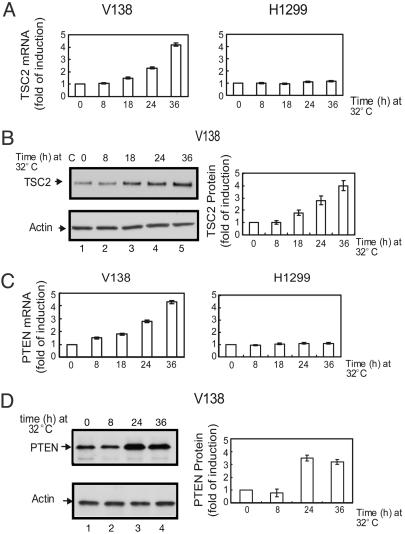
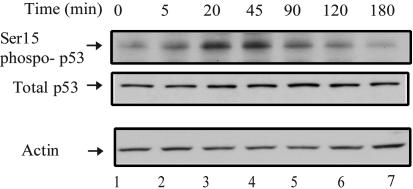
Cell growth and proliferation requires an intricate coordination between the stimulatory signals arising from nutrients and growth factors and the inhibitory signals arising from intracellular and extracellular stresses. Alteration of the coordination often causes cancer. In mammals, the mTOR (mammalian target of rapamycin) protein kinase is the central node in nutrient and growth factor signaling, and p53 plays a critical role in sensing genotoxic and other stresses. The results presented here demonstrate that activation of p53 inhibits mTOR activity and regulates its downstream targets, including autophagy, a tumor suppression process. Moreover, the mechanisms by which p53 regulates mTOR involves AMP kinase activation and requires the tuberous sclerosis (TSC) 1/TSC2 complex, both of which respond to energy deprivation in cells. In addition, glucose starvation not only signals to shut down mTOR, but also results in the transient phosphorylation of the p53 protein. Thus, p53 and mTOR signaling machineries can cross-talk and coordinately regulate cell growth, proliferation, and death.


Figures

Fig. 1.
Fig. 1.
Signal transduction pathways leading to mTOR activation.
Fig. 2.
Fig. 2.
mTOR activity is inhibited by p53 activation. WT (p53+/+)(A and C) or p53-/- (B) MEFs were treated with or without different drugs (etop, 20 μM etoposide; rapa, 100 nM rapamycin) as indicated for 24 h (A and B) or for the indicated amount of time (C). The p53 temperature-sensitive cell line V138 (D) was shifted to 32°C for the indicated amount of time. All of these cells were then harvested, and Western blot analyses were performed to determine the levels of phosphorylated p70S6K at Thr-389 with phosphorylation-specific antibody, which recognizes both phosphorylated p85 S6K at Thr-412 (upper band as indicated) and phosphorylated p70 S6K at Thr-389 (lower band as indicated). Only phosphorylated-p70 S6K (T389) is shown in C and D. Ran or actin protein levels serve as loading controls.
Fig. 3.
Fig. 3.
p53 activation increases autophagy levels. (A and B) WT MEFs were treated with (A) or without (B)20 μM etoposide for 24 h. Cells were then fixed and analyzed by electron microscopy. A and B show typical morphology of the majority of cells in each sample. Arrows in A indicate typical autophagic vacuoles. (C) WT or p53-/- MEFs were treated with or without etoposide for 12 h as indicated. The levels of MAP-LC3-I, MAP-LC3-II, and p53 were determined by Western blot analyses with MAP-LC3 and p53 antibodies. Ran levels serve as loading controls.
Fig. 4.
Fig. 4.
mTOR inhibition by p53 in MEFs requires both TSC1 and TSC2. (A) TSC1-/- MEFs. (B) WTor TSC2-/- p53-/- MEFs, as indicated, were treated with 20 μM etoposide for the indicated amount of time. (C) TSC2-/- p53-/- MEFs were transiently transfected with either p53 expression vector or empty control vector as indicated. Twenty-four hours posttransfection, the cells were treated with 20 μM etoposide as indicated or left untreated for 8 h (lanes 3 and 4) or 12 h (lanes 1, 2, 5, and 6). Cells from A, B, and C were collected, and the levels of phosphorylated p70S6K (T389), p53, and actin were determined by Western blot analyses.
Fig. 5.
Fig. 5.
p53 activation increases AMPK activity, and the activation of AMPK is required for mTOR inhibition by p53. (A) p53+/+ and p53-/- MEFs were treated with 20 μM etoposide, left untreated, or glucose-starved as indicated for the indicated amount of time. (B) p53+/+ MEFs were treated with 20 μM etoposide or left untreated, either in the absence or presence of compound C (20 μM) as indicated for the indicated amount of time. (C) V138 cells cultured at 37°C were treated with a 10 μM or 20 μM concentration of the AMPK inhibitor compound C or left untreated as indicated, immediately shifting to 32°C or remaining at 37°C, as indicated, for an additional culture for 8 h. At the end of each treatment, cells were collected, and the levels of phosphorylated AMPK (T172), phosphorylated p70S6K (T389), and actin were determined by Western blot analyses.
Fig. 6.
Fig. 6.
The mRNA and protein levels of PTEN and TSC2 are up-regulated upon p53 activation in V138 cells. (A and C) V138 cells and the parental H1299 cells were cultured at 37°C for 24 h before being shifted to 32°C for the indicated amount of time. Cells were collected, and total RNA were prepared. The mRNA levels of TSC2 (A) and PTEN (C) were determined by real-time PCR and normalized against the mRNA levels of actin. (B and D) V138 cells were cultured at 37°C for 24 h before being shifted to 32°C for the indicated amount of time. Cells were collected, and the protein levels of TSC2 (B) and PTEN (D) were detected by Western blot analyses. The levels of protein expression were quantified by densitometry and normalized against those of actin.
Fig. 7.
Fig. 7.
Glucose starvation induces a rapid and transient phosphorylation of p53 at Ser-15. HCT116 p53+/+ cells were cultured in complete medium for 24 h before being switched to medium without glucose for the indicated amount of time. Cells were collected, and the levels of phosphorylated p53 at Ser-15, total p53, and actin were determined by Western blot analyses.

References

    1. Hay, N. & Sonenberg, N. (2004) Genes Dev. 18, 1926-1945. - PubMed
    1. Harris, T. E. & Lawrence, J. C., Jr. (2003) Sci. STKE 2003, re15. - PubMed
    1. Kim, D. H. & Sabatini, D. M. (2004) Curr. Top. Microbiol. Immunol. 279, 259-270. - PubMed
    1. Inoki, K., Zhu, T. & Guan, K. L. (2003) Cell 115, 577-590. - PubMed
    1. Brown, E. J., Beal, P. A., Keith, C. T., Chen, J., Shin, T. B. & Schreiber, S. L. (1995) Nature 377, 441-446. - PubMed

MeSH terms

LinkOut - more resources