. 2005 Jun 7;102(23):8269-74.
doi: 10.1073/pnas.0502702102. Epub 2005 May 31.

Genomic analysis of Drosophila chromosome underreplication reveals a link between replication control and transcriptional territories

Affiliations

Genomic analysis of Drosophila chromosome underreplication reveals a link between replication control and transcriptional territories

Stepan N Belyakin et al. Proc Natl Acad Sci U S A. .

Abstract

In Drosophila polytene chromosomes, most late-replicating regions remain underreplicated. A loss-of-function mutant of the suppressor of underreplication [Su(UR)] gene suppresses underreplication (UR), whereas extra copies of this gene enhance the level and number of regions showing UR. By combining DNA microarray analysis with manipulation of the number of Su(UR) gene copies, we achieved genomic-scale molecular identification of 1,036 genes that are arranged in clusters located in 52 UR chromosomal regions. These regions overlap extensively (96%) but are not completely identical with late-replicating regions of mitotically dividing Kc cells in culture. Reanalysis of published gene expression profiles revealed that genomic regions defined by replication properties include clusters of coordinately expressed genes. Genomic regions that are UR in polytene chromosomes and late replicated in Kc cell chromosomes show a particularly common association with transcriptional territories that are expressed in testis/males but not ovary/females or embryos. An attractive hypothesis for future testing is that factors involved in replication control, such as SU(UR), may interact physically with those involved in epigenetic silencing of transcription territories.


Figures
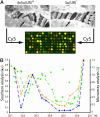
Fig. 1.
Fig. 1.
Principle of detecting UR regions with DNA microarray analysis. (A) (Upper) In the salivary gland polytene chromosomes of the 4xSu(UR)+ line (Left) UR is augmented and results in weak spots, yielding characteristic breaks (region 89E arrow), whereas in Su(UR) mutants (Right) UR and breaks are no longer detected. Genomic DNAs prepared from salivary glands of female third instar larvae of the Su(UR)- and 4xSu(UR)+ lines were fluorescently labeled with Cy5 and Cy3, respectively, mixed, and hybridized to glass slide DNA microarrays. (Lower) Red spots in the microarray image represent genes that are overrepresented in the Su(UR)- line and correspondingly underrepresented in the 4xSu(UR)+ line. (B) Abundance profile of DNA from the 19E region of the polytene X chromosome of female larvae of the 4xSu(UR)+ strain, obtained by using microarrays (diamonds) and Southern blot validation of differences in DNA abundance in the WT and 4xSu(UR)+ strains (yellow and blue dots, respectively). DNA fragments spaced 30–90 kb apart were used as probes for Southern blot analysis; therefore, the data points do not necessarily correspond to those of the microarray analysis. Abscissa: Genomic physical map according to the Drosophila genome annotation 3.1 (www.ensembl.org). Ordinates: Normalized Cy-3/Cy-5 signal ratios in the microarray experiments (right axis) and relative DNA abundance in Southern blots using the rosy gene as a calibrator (left axis).
Fig. 2.
Fig. 2.
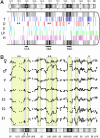
Comparisons of UR profiles in salivary glands (diamonds) and LR in Kc cells (7) (triangles) in the indicated chromosomal regions. The detected boundaries of the UR (green) and LR (red) regions are indicated with vertical dashed lines. (A)(Upper) Coincidence of UR in salivary glands and LR in Kc cells in UR region 58A. Genes that are highly expressed in testis (26) are indicated with red diamonds. (Lower) The known developmental expression profile of nine genes (encircled diamonds) from the developmental data set (19). E, embryo; L, larva; P, pupa; Am, adult male; Af, adult female. (B) DNA abundance profile in LU-R region 78E, which shows LR in Kc cells and not UR in salivary glands. ER is an adjacent ER region in Kc cells. (C) Comparison of the LR in Kc cells and UR in salivary gland in the region 64D: LR in Kc cells clearly extends beyond the UR region in salivary gland polytene chromosomes (LfUR). Abscissa: Genomic physical map according to the Drosophila genome annotation 3.1 (www.ensembl.org). Ordinates: LR, replication timing in Kc cells presented as log2-transformed ratios of DNA abundance at early vs. late S phase of the cell cycle (7); UR, DNA polytenization levels presented as ratios of DNA abundance in 4xSu(UR)+ vs. Su(UR)- larval salivary glands.
Fig. 3.
Fig. 3.
Most UR regions show enrichment in genes that are highly expressed in the adult male (testis) and silenced in the adult female (ovary) and embryo. A similar but less prominent pattern is detected in the LU-R regions of 2L and 2R. In the five rows of panels, genes are classified according to their location in the D. melanogaster chromosomal arms, and the vertical columns represent the various replication-related regions. (A) The ordinate shows the percentage of genes categorized as specific in the cDNA data set (26) (blue, testis; red, ovary; cyan, embryo; green, larva/pupa; and violet, head) in the four different replication-related regions and in the entire chromosomal arm (Sum). Horizontal bars below each diagram indicate statistically significant differences (contingency table test) with P < 0.001 cutoffs. (B) Average expression of genes (log2-transformed) from the developmental data set (19) (red, up-regulation; green, down-regulation) in each of the four types of replication-related regions (ordinate). The baseline expression of the entire data set is indicated in black in all panels. In the original data set, the expression of each gene was referenced to a mixture of all developmental stages, normalized for the median, and log-transformed. This total intensity normalization probably explains a small bias toward down-regulation. Horizontal bars that are shown below the diagrams indicate areas of the averaged expression profile that exhibit significant (Student's t test, P < 0.001) deviation from the average expression profile of the entire chromosomal arm. Abscissa: 75 developmental time points starting from unfertilized eggs to adult flies. E, Embryo; L, larvae; P, pupae; Am, adult male; Af, adult female.
Fig. 4.
Fig. 4.
Correlation of replication-related regions with transcriptional territories in a 5.8-megabase fragment of the chromosomal arm 2R. On the top and bottom are the genomic scales with the regions of different replication timing presented as shaded boxes. Asterisks (* or **) indicate transcriptional territories discussed in the text. (A) Schematic representation of the four replication-related related regions (first and last rows of the vertical bars: UR, black; LU-R and LfUR, gray; ER, no color) and the five types of specifically expressed genes from the cDNA data set (26). Characterized genes are shown in five vertical differently colored bars (testis, blue; ovary, red; embryo, cyan; larva/pupa, green; and head, violet). (B) Detection of transcriptional territories (boxed) using the developmental gene expression data (19) and a sliding window across the genome. E1, embryo aged 0–3 h; E2, embryo aged 3–10 h; E3, embryo aged 10–24 h; L, larva; P, pupa; Am, adult male; Af, adult female. Each dot reflects the degree of gene activation: below the horizontal gray line indicates down-regulation, and above the line indicates up-regulation for each of seven selected stages.

Similar articles

Cited by

References

    1. Berezney, R., Dubey, D. D. & Huberman, J. A. (2000) Chromosoma 108, 471-484. - PubMed
    1. Jackson, D. A. & Pombo, A. (1998) J. Cell Biol. 140, 1285-1295. - PMC - PubMed
    1. MacAlpine, D. M., Rodriguez, H. K. & Bell, S. P. (2004) Genes Dev. 18, 3094-3105. - PMC - PubMed
    1. Gilbert, D. M. (2002) Curr. Opin. Cell Biol. 14, 377-383. - PubMed
    1. McNairn, A. J. & Gilbert, D. M. (2003) BioEssays 25, 647-656. - PubMed

Publication types