. 2005 Jun 6;169(5):765-75.
doi: 10.1083/jcb.200503083. Epub 2005 May 31.

Inp1p is a peroxisomal membrane protein required for peroxisome inheritance in Saccharomyces cerevisiae

Affiliations

Inp1p is a peroxisomal membrane protein required for peroxisome inheritance in Saccharomyces cerevisiae

Monica Fagarasanu et al. J Cell Biol. .

Abstract

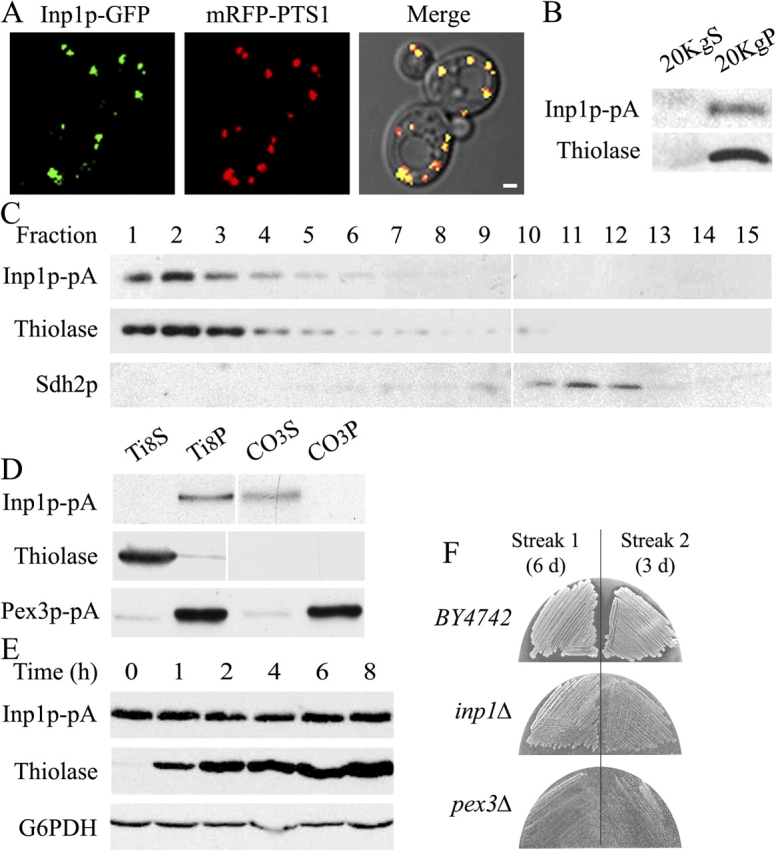
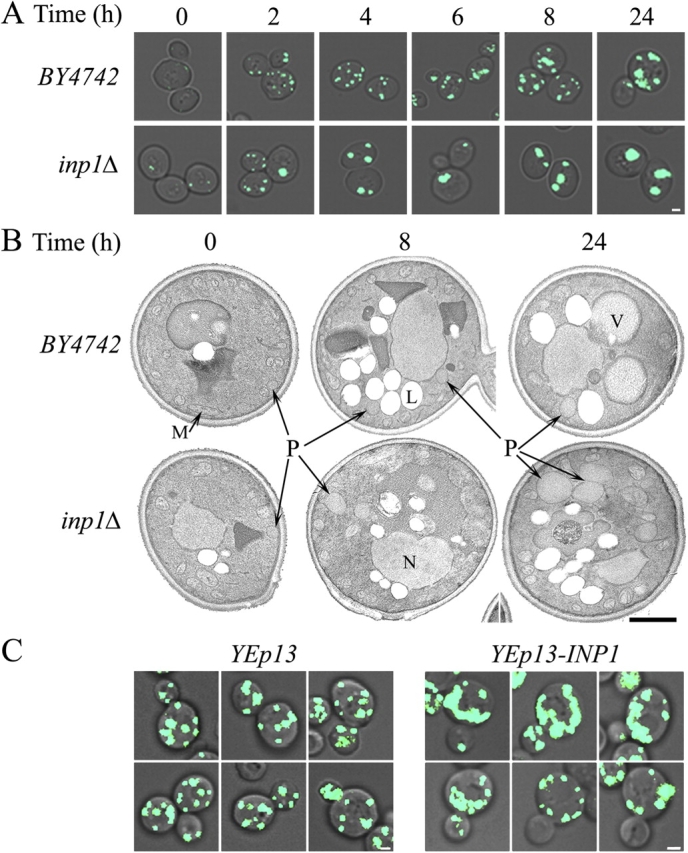
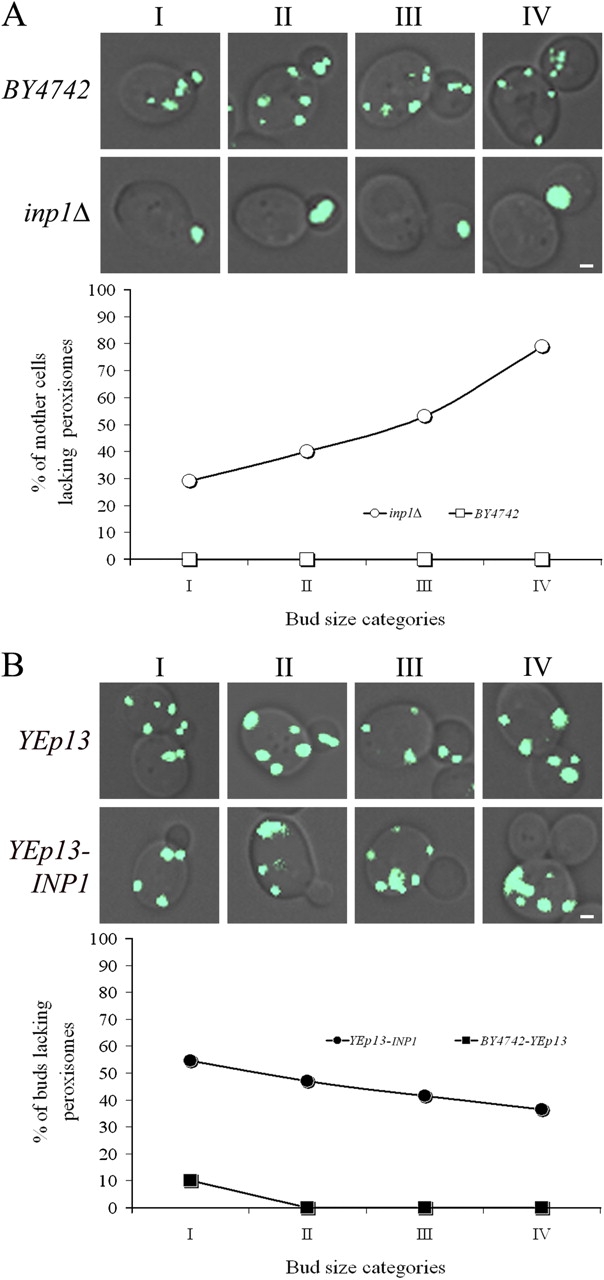
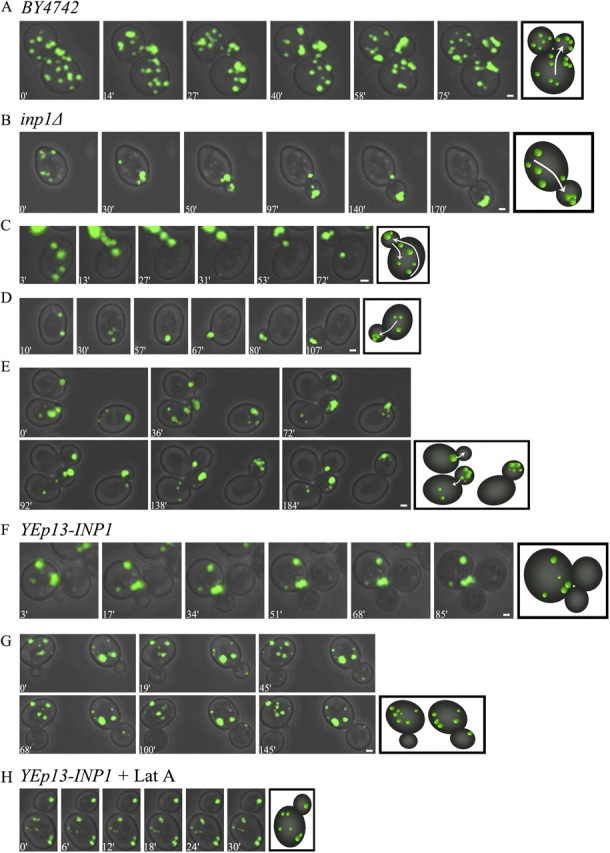
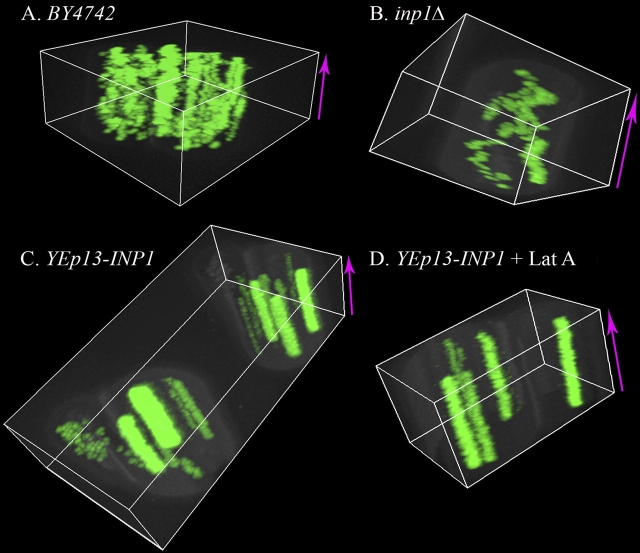
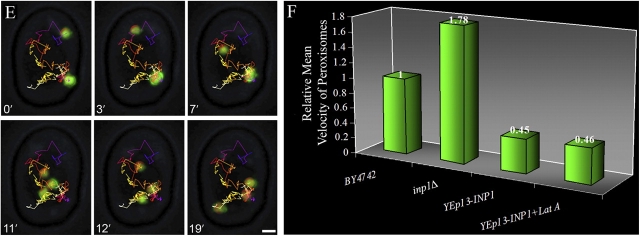
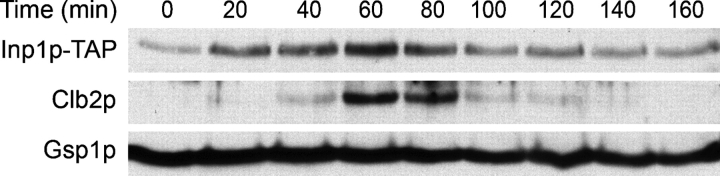
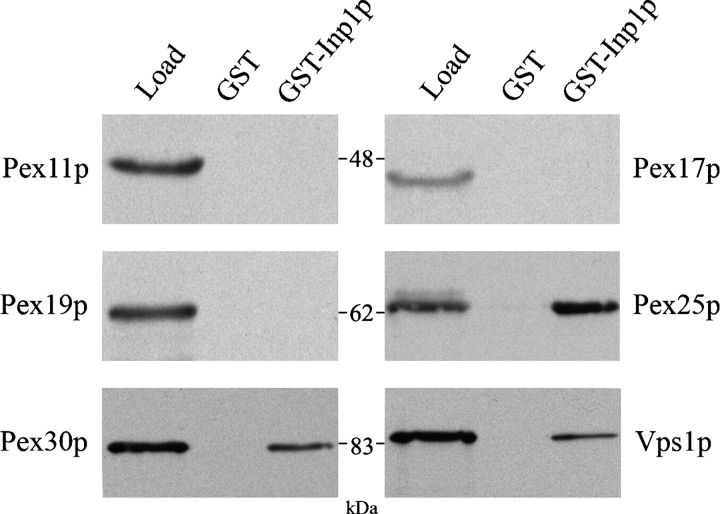
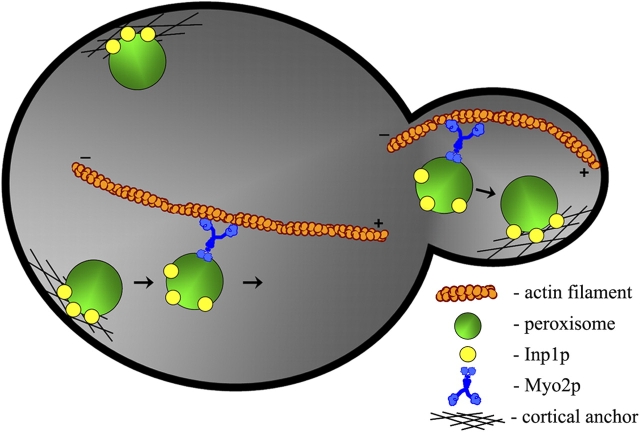
Cells have evolved molecular mechanisms for the efficient transmission of organelles during cell division. Little is known about how peroxisomes are inherited. Inp1p is a peripheral membrane protein of peroxisomes of Saccharomyces cerevisiae that affects both the morphology of peroxisomes and their partitioning during cell division. In vivo 4-dimensional video microscopy showed an inability of mother cells to retain a subset of peroxisomes in dividing cells lacking the INP1 gene, whereas cells overexpressing INP1 exhibited immobilized peroxisomes that failed to be partitioned to the bud. Overproduced Inp1p localized to both peroxisomes and the cell cortex, supporting an interaction of Inp1p with specific structures lining the cell periphery. The levels of Inp1p vary with the cell cycle. Inp1p binds Pex25p, Pex30p, and Vps1p, which have been implicated in controlling peroxisome division. Our findings are consistent with Inp1p acting as a factor that retains peroxisomes in cells and controls peroxisome division. Inp1p is the first peroxisomal protein directly implicated in peroxisome inheritance.


Figures

Figure 1.
Figure 1.
Inp1p is a peripheral membrane protein of peroxisomes. (A) Inp1p-GFP colocalizes with mRFP-PTS1 to punctate structures characteristic of peroxisomes by direct confocal microscopy. The right panel presents the merged image of the left and middle panels in which colocalization of Inp1p-GFP and mRFP-PTS1 is shown in yellow. Bar, 1 μm. (B) Inp1p-pA localizes to the 20KgP subcellular fraction enriched for peroxisomes. Immunoblot analysis of equivalent portions of the 20KgS and 20KgP subcellular fractions from cells expressing Inp1p-pA was performed with antibodies to the peroxisomal matrix enzyme, thiolase. (C) Inp1p-pA cofractionates with peroxisomes. Organelles in the 20KgP fraction were separated by isopycnic centrifugation on a discontinuous Nycodenz gradient. Fractions were collected from the bottom of the gradient, and equal portions of each fraction were analyzed by immunoblotting. Fractions enriched for peroxisomes and mitochondria were identified by immunodetection of thiolase and Sdh2p, respectively. (D) Purified peroxisomes were ruptured by treatment with Ti8 buffer and subjected to ultracentrifugation to obtain a supernatant fraction, Ti8S, enriched for matrix proteins and a pellet fraction, Ti8P, enriched for membrane proteins. The Ti8P fraction was treated further with alkali Na2CO3 and separated by ultracentrifugation into a supernatant fraction (CO3S) enriched for peripherally associated membrane proteins and a pellet fraction (CO3P) enriched for integral membrane proteins. Equivalent portions of each fraction were analyzed by immunoblotting. Immunodetection of thiolase and Pex3p-pA marked the fractionation profiles of a peroxisomal matrix and integral membrane protein, respectively. White lines indicate that intervening lanes have been spliced out. (E) The synthesis of Inp1p-pA is constant during incubation of S. cerevisiae in oleic acid medium. Cells grown for 16 h in YPD medium were transferred to, and incubated in, YPBO medium. Aliquots of cells were removed from the YPBO medium at the indicated times, and total cell lysates were prepared. Equal amounts of protein from the lysates were separated by SDS-PAGE, and Inp1p-pA, thiolase, and G6PDH were detected by immunoblot analysis. Antibodies against G6PDH were used to confirm the loading of equal amounts of protein in each lane. (F) inp1Δ cells are retarded in their growth on oleic acid medium. Cells of the wild-type strain BY4742, the deletion strain inp1Δ and the peroxisome assembly mutant strain pex3Δ were grown on YPD agar and then streaked onto YPBO agar (Streak 1). After 3 d of incubation, cells were sampled from Streak 1 and restreaked onto the same YPBO agar (Streak 2). Incubation was continued for a further 3 d.
Figure 2.
Figure 2.
Cells deleted for INP 1 exhibit an abnormal peroxisome phenotype. (A) The wild-type strain BY4742 and the deletion strain inp1Δ expressing genomically integrated POT1-GFP encoding peroxisomal thiolase tagged at its carboxyl terminus with GFP (Pot1p-GFP) were grown for 16 h in glucose-containing YPD medium and then transferred to oleic acid-containing YPBO medium. Fluorescent images of cells at different times of incubation in YPBO medium were captured by confocal microscopy. Bar, 1 μm. (B) Ultrastructure of BY4742 and inp1Δ cells at different times of incubation in oleic acid medium. Cells were cultured as in A and then fixed and processed for EM. P, peroxisome; M, mitochondrion; N, nucleus; V, vacuole; L, lipid droplet. (C) Effects of INP1 overexpression on the peroxisome phenotype. The strain BY4742/POT1-GFP was transformed with the empty multicopy plasmid YEp13 (left) or with YEp13 containing the INP1 gene (right) for overexpression of INP1. Cells grown in SM medium for 16 h were transferred to and incubated in oleic acid-containing YNO medium for 8 h. Images were captured with a LSM510 META laser scanning microscope. Bars, 1 μm.
Figure 3.
Figure 3.
Deletion or overexpression of INP 1 leads to defects in partitioning peroxisomes between mother cell and bud. (A) Wild-type and inp1Δ cells expressing POT1-GFP to fluorescently label peroxisomes were incubated for 16 h in SCIM-containing glucose and oleic acid to allow for cell division and proliferation of peroxisomes. Fluorescent images of budded cells were acquired by confocal microscopy. Mother cells were scored for the presence or absence of fluorescent peroxisomes. Buds were sized according to four categories relative to the volume of the mother cell, expressed as a percentage of the mother cell volume (category I, 0–12%; category II, 12–24%; category III, 24–36%; category IV, 36–48%; see Materials and methods). Quantification was performed on at least 20 budded cells from each category. (B) Wild-type and INP1-overexpressing cells synthesizing Pot1p-GFP to label peroxisomes were incubated in SCIM and examined by confocal microscopy as described in A. Buds were scored for the presence or absence of fluorescent peroxisomes, sized and categorized, and quantification was performed, as defined in A. Bars, 1 μm.
Figure 4.
Figure 4.
Peroxisome movement during cell division as visualized by 4D in vivo video microscopy. Peroxisomes were fluorescently labeled with genomically encoded Pot1p-GFP. Cells grown in SCIM for 16 h were placed onto a slide covered with a thin agarose pad containing SCIM. Cells were visualized at RT on a LSM 510 META confocal microscope specially modified for 4D in vivo video microscopy (see Materials and methods). Representative frames from videos show the specific movements of peroxisomes within each strain. (A) Wild-type BY4742 cells. Some peroxisomes move directionally from mother cell to bud. A population of peroxisomes remains within the mother cell (Video 1). (B–E) inp1Δ cells. (B) The peroxisomes present in the mother cell before bud emergence (0′) gather at the presumptive bud site (30′). Subsequently, all peroxisomes are transported into the growing bud (30′–170′). Inside the bud, peroxisomes localize to sites of active growth, being initially clustered at the bud tip and then relocated to the bud neck region before cytokinesis (Video 2). (C) Peroxisomes present in the mother cell (3′) move into the bud (31′). One peroxisome then returns to the mother cell from the bud (72′; Video 3). (D) Initially, peroxisomes perform saltatory movements (10′–30′) and are then inserted into the growing bud (57′–107′; Video 4). (E) All peroxisomes present in the mother cells before bud emergence move into the buds (72′; Video 5). In the topmost cell, a peroxisome passes with difficulty into the bud due to its large size (0′–36′). In the cell at bottom, left, peroxisomes gather at the bud site (0′–3′) and eventually enter the forming bud. At 92′, one peroxisome returns to the mother cell. Some peroxisomes remain in the mother cell and display chaotic movements. In the cell at bottom, right, peroxisomes display chaotic movements (0′–18′) and then gather at the new bud site. Eventually, all peroxisomes move into the bud (184′; Video 5). (F and G) Wild-type BY4742 cells overexpressing INP1. (F) Peroxisomes appear immobile (0′–145′). Analysis of individual optical sections from the 4D data showed the peroxisomes to be located at the cell cortex. Both first and second generation buds lack peroxisomes (Video 6). (G) Peroxisomes retain fixed cortical positions in mother cells. One peroxisome reaches the bud, keeps its mobility for a defined period of time (until 100′) and eventually becomes immobile (after 100′; Video 7). (H) Treatment of cells overexpressing INP1 with the actin-disrupting toxin Lat A does not affect the mobility and localization of peroxisomes. Bars, 1 μm.
Figure 5.
Figure 5.
Quantification of peroxisome mobility. (A–D) 100 projections corresponding to the first 20 min of the videos corresponding to Fig. 4 (A, D, G, and H) were analyzed with Imaris 4.1 (Bitplane), and 3D models were constructed. The z-axis (purple arrows) represents time. A peroxisome that maintains its x-y position for the period of time considered and which is essentially immobile is represented by a fluorescent column parallel to the z-axis. A mobile peroxisome is represented by fluorescent spots that have different x-y positions in time. Corresponding animations are presented in Videos 8–10. (E) Tracking peroxisomes in inp1Δ cells. Peroxisomes in inp1Δ cells were tracked by analyzing the first 100 projections of Video 4 with Imaris 4.1. The trajectories of individual peroxisomes are shown as different colored lines. Bar, 1 μm. (F) Peroxisomes of inp1Δ cells are highly mobile. The velocities of individual peroxisomes across individual time points were measured using Imaris 4.1, and an average velocity was obtained for each peroxisome. The average velocities of individual peroxisomes in a given strain were in turn averaged to obtain the mean velocity of peroxisomes in that strain. The mean velocity of peroxisomes in a given strain are expressed relative to the mean velocity of peroxisomes of the wild-type strain, which is taken as 1.
Figure 5.
Figure 5.
Quantification of peroxisome mobility. (A–D) 100 projections corresponding to the first 20 min of the videos corresponding to Fig. 4 (A, D, G, and H) were analyzed with Imaris 4.1 (Bitplane), and 3D models were constructed. The z-axis (purple arrows) represents time. A peroxisome that maintains its x-y position for the period of time considered and which is essentially immobile is represented by a fluorescent column parallel to the z-axis. A mobile peroxisome is represented by fluorescent spots that have different x-y positions in time. Corresponding animations are presented in Videos 8–10. (E) Tracking peroxisomes in inp1Δ cells. Peroxisomes in inp1Δ cells were tracked by analyzing the first 100 projections of Video 4 with Imaris 4.1. The trajectories of individual peroxisomes are shown as different colored lines. Bar, 1 μm. (F) Peroxisomes of inp1Δ cells are highly mobile. The velocities of individual peroxisomes across individual time points were measured using Imaris 4.1, and an average velocity was obtained for each peroxisome. The average velocities of individual peroxisomes in a given strain were in turn averaged to obtain the mean velocity of peroxisomes in that strain. The mean velocity of peroxisomes in a given strain are expressed relative to the mean velocity of peroxisomes of the wild-type strain, which is taken as 1.
Figure 6.
Figure 6.
Peroxisomes are actively retained in the mother cell. Wild-type BY4742/POT1-GFP cells grown to mid-log phase in YPD medium were arrested in S phase by the addition of 200 mM hydroxyurea for 6 h. Fluorescent images of arrested cells were captured as a z-stack (bottom, middle, top) by confocal microscopy. The bottom cell is the mother cell, and the top cell is the hyperelongated bud. Bar, 1 μm.
Figure 7.
Figure 7.
Overproduced Inp1p is localized to peroxisomes and the cell cortex. The strain BY4742/POT1-RFP transformed with a multicopy YEp13 plasmid construct overexpressing INP1-GFP were grown to mid-log phase in glucose-containing SM medium and examined by confocal microscopy. Overproduced Inp1p-GFP is localized to both peroxisomes and the cell cortex. Bar, 1 μm.
Figure 8.
Figure 8.
The levels of Inp1p vary with the cell cycle. Cells expressing TAP-tagged Inp1p were grown for 16 h in YPD and synchronized in G1 by addition of α factor (0 min). After removal of α factor, cells were incubated in YPD at 23°C. Samples were removed at the indicated times, and total cell lysates were prepared, separated by SDS-PAGE, transferred to nitrocellulose, and analyzed by immunoblotting with antibodies directed against the TAP tag, the cyclin Clb2p or Gsp1p (Ran). Gsp1p serves as a control for protein loading.
Figure 9.
Figure 9.
Inp1p binds Pex25p, Pex30p, and Vps1p. GST-Inp1p and GST alone were immobilized on glutathione Sepharose and incubated with whole cell lysates containing TAP-tagged peroxins or Vps1p. Lysates and bound fractions were resolved by SDS-PAGE, and TAP chimeras were detected by immunoblotting with anti-TAP antibody. Inp1p interacts with Pex25p, Pex30p, and Vps1p but not with Pex11p, Pex17p, Pex19p, or GST alone. Load represents 10% of the quantity of lysate applied to glutathione Sepharose for pull downs.
Figure 10.
Figure 10.
A model for Inp1p function in peroxisome retention. Peroxisomes move along polarized actin cables in a Myo2p-dependent manner from mother cell to bud. Concomitantly, a subset of peroxisomes is retained within the mother cell. Inp1p acts to link peroxisomes to a cortical anchor and retain peroxisomes in the mother cell and bud.

References

    1. Adames, N.R., J.R. Oberle, and J.A. Cooper. 2001. The surveillance mechanism of the spindle position checkpoint in yeast. J. Cell Biol. 153:159–168. - PMC - PubMed
    1. Berger, K.H., L.F. Sogo, and M.P. Yaffe. 1997. Mdm12p, a component required for mitochondrial inheritance that is conserved between budding and fission yeast. J. Cell Biol. 136:545–553. - PMC - PubMed
    1. Boldogh, I.R., H.C. Yang, D.W. Nowakowski, S.L. Karmon, L.G. Hays, J.R. Yates III, and L.A. Pon. 2001. Arp2/3 complex and actin dynamics are required for actin-based mitochondrial motility in yeast. Proc. Natl. Acad. Sci. USA. 98:3162–3167. - PMC - PubMed
    1. Boldogh, I.R., D.W. Nowakowski, H.C. Yang, H. Chung, S. Karmon, P. Royes, and L.A. Pon. 2003. A protein complex containing Mdm10p, Mdm12p, and Mmm1p links mitochondrial membranes and DNA to the cytoskeleton-based segregation machinery. Mol. Biol. Cell. 14:4618–4627. - PMC - PubMed
    1. Boldogh, I.R., S.L. Ramcharan, H.-C. Yang, and L.A. Pon. 2004. A type V myosin (Myo2p) and a Rab-like G-protein (Ypt11p) are required for retention of newly inherited mitochondria in yeast cells during cell division. Mol. Biol. Cell. 15:3994–4002. - PMC - PubMed

Publication types

MeSH terms