. 2005 Aug 11;22(3):292-307.
doi: 10.1152/physiolgenomics.00217.2004. Epub 2005 May 31.

Gene expression and phenotypic characterization of mouse heart after chronic constant or intermittent hypoxia

Affiliations

Gene expression and phenotypic characterization of mouse heart after chronic constant or intermittent hypoxia

Chenhao Fan et al. Physiol Genomics. .

Abstract

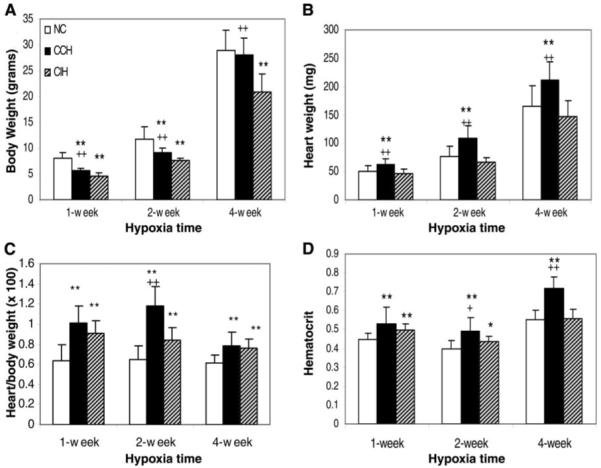
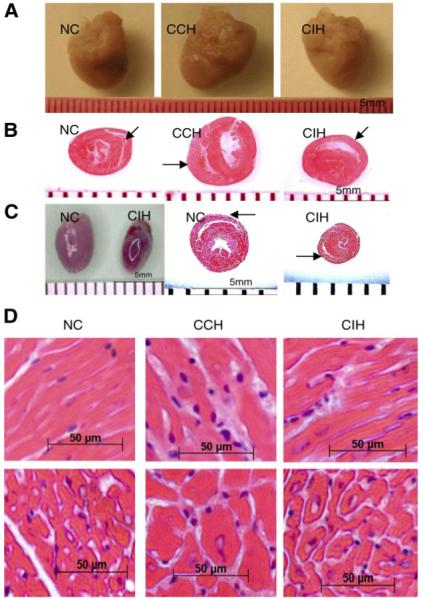
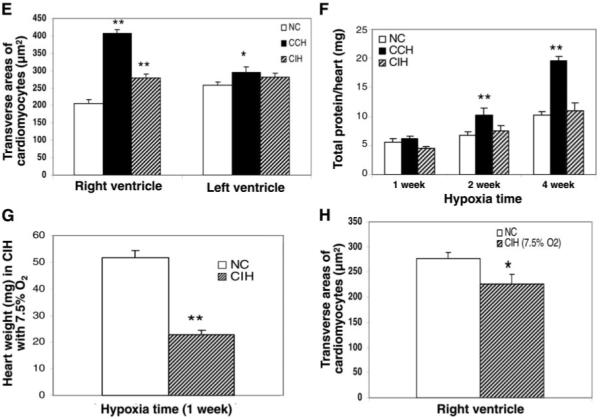
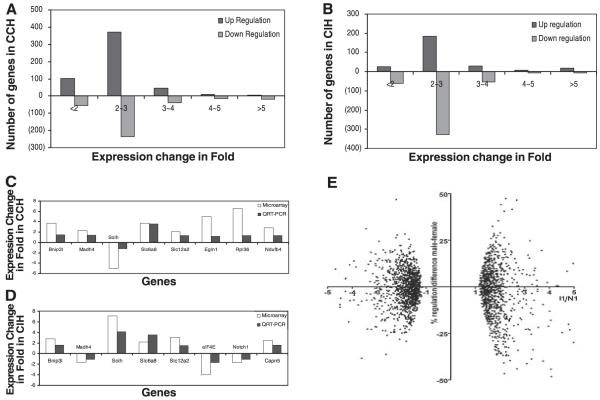
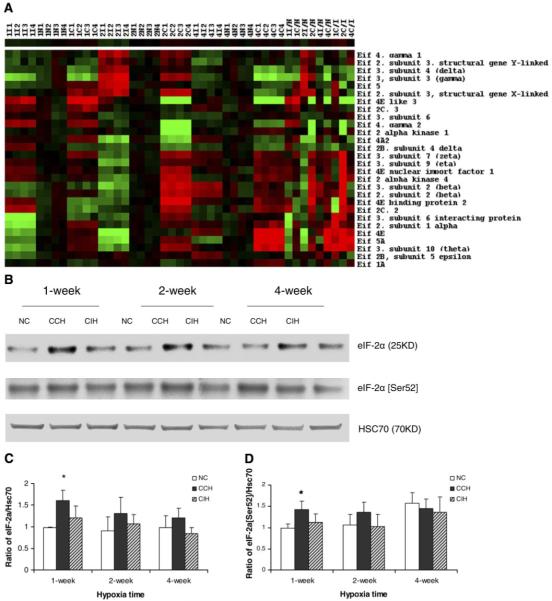
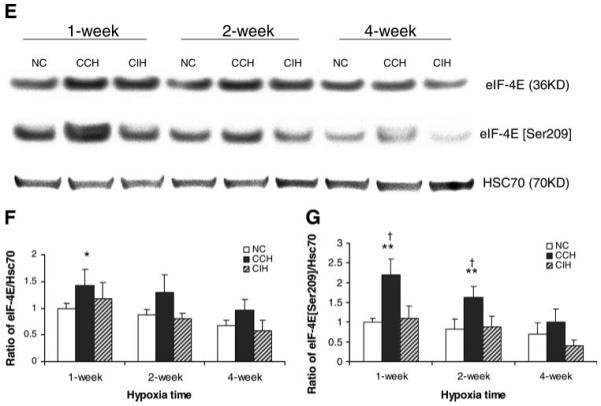
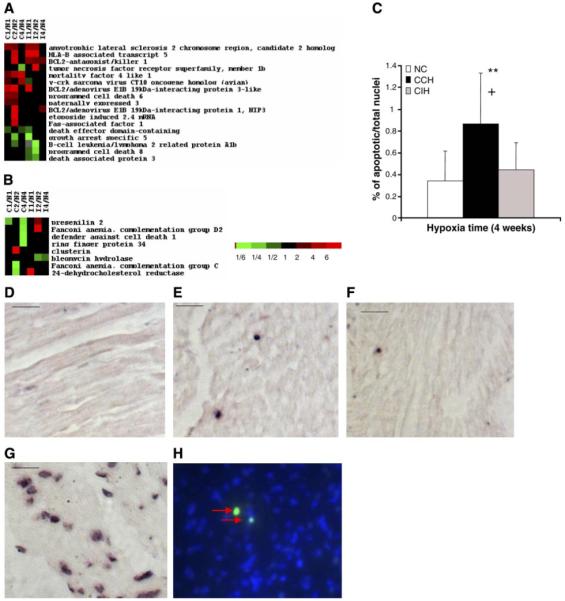
Chronic constant hypoxia (CCH), such as in pulmonary diseases or high altitude, and chronic intermittent hypoxia (CIH), such as in sleep apnea, can lead to major changes in the heart. Molecular mechanisms underlying these cardiac alterations are not well understood. We hypothesized that changes in gene expression could help to delineate such mechanisms. The current study used a neonatal mouse model in CCH or CIH combined with cDNA microarrays to determine changes in gene expression in the CCH or CIH mouse heart. Both CCH and CIH induced substantial alterations in gene expression. In addition, a robust right ventricular hypertrophy and cardiac enlargement was found in CCH- but not in CIH-treated mouse heart. On one hand, upregulation in RNA and protein levels of eukaryotic translation initiation factor-2alpha and -4E (eIF-2alpha and eIF-4E) was found in CCH, whereas eIF-4E was downregulated in 1- and 2-wk CIH, suggesting that eIF-4E is likely to play an important role in the cardiac hypertrophy observed in CCH-treated mice. On the other hand, the specific downregulation of heart development-related genes (e.g., notch gene homolog-1, MAD homolog-4) and the upregulation of proteolysis genes (e.g., calpain-5) in the CIH heart can explain the lack of hypertrophy in CIH. Interestingly, apoptosis was enhanced in CCH but not CIH, and this was correlated with an upregulation of proapoptotic genes and downregulation of anti-apoptotic genes in CCH. In summary, our results indicate that 1) the pattern of gene response to CCH is different from that of CIH in mouse heart, and 2) the identified expression differences in certain gene groups are helpful in dissecting mechanisms responsible for phenotypes observed.


Figures

Fig. 1
Fig. 1
Changes in body weight, heart weight, and hematocrit in mice with chronic constant hypoxia (CCH) and chronic intermittent hypoxia (CIH). A: growth of mice was decreased in both CCH (n = 8/treatment) and CIH (n = 8/treatment) compared with normoxic control (NC; n = 16/age-matched group), but there was a catch-up growth in CCH treatment for 4 wk. B: heart weight was much higher in CCH, but CIH mice were similar to NC mice. C and D: ratios of heart weight to body weight and hematocrit increased in CCH and CIH but more so in CCH. Statistical significance was calculated by Student’s t-test. Values are means ± SD. *P < 0.05 and **P < 0.01, CCH or CIH compared with NC. +P < 0.05 and ++P < 0.01, CCH compared with CIH.
Fig. 2
Fig. 2
Effect of chronic hypoxia treatment on heart size/weight and cardiomyocyte size in mice. A: representative images show larger heart size in CCH compared with age-matched NC. B: coronal midline sections show the apparently thicker right ventricular wall in CCH but little change in CIH (arrows) compared with age-matched NC. C: in CIH with a 7.5% O2 level as the nadir in each cycle, heart size became even smaller after 1 wk of hypoxia exposure compared with age-matched NC (death occurred in prolonged hypoxia period). D: light microscopy (×400) shows markedly thicker right ventricular muscle fibers in CCH but not CIH and broader interstitium with leukocyte infiltration in both CCH and CIH. E: in transverse section of cardiomyocytes, the cell size (mean ± SE) in the right ventricle was robustly thicker in CCH (P < 0.05) and thicker, but to a much lesser extent, in CIH compared with NC. F: total protein/heart changes over time under NC, CCH, and CIH. Neonatal P2 mice (2nd day after birth) were weighed, and mice of similar weight were separated into 3 groups and treated under NC, CCH, or CIH. Hearts were obtained after 1, 2, and 4 wk of hypoxia, and total proteins were measured in individual hearts (n = 4). Hearts of mice treated with CCH contained much more protein compared with NC and CIH hearts at the same time points. G and H: heart weight (n = 8) was lower in CIH than in NC when 7.5% O2 rather than 11% O2 was applied. The size of cardiomyocytes in the transverse section was smaller than in NC after 1 wk of hypoxia exposure. Values are means ± SD. *P < 0.05 and **P < 0.01, CCH or CIH compared with NC.
Fig. 2
Fig. 2
Effect of chronic hypoxia treatment on heart size/weight and cardiomyocyte size in mice. A: representative images show larger heart size in CCH compared with age-matched NC. B: coronal midline sections show the apparently thicker right ventricular wall in CCH but little change in CIH (arrows) compared with age-matched NC. C: in CIH with a 7.5% O2 level as the nadir in each cycle, heart size became even smaller after 1 wk of hypoxia exposure compared with age-matched NC (death occurred in prolonged hypoxia period). D: light microscopy (×400) shows markedly thicker right ventricular muscle fibers in CCH but not CIH and broader interstitium with leukocyte infiltration in both CCH and CIH. E: in transverse section of cardiomyocytes, the cell size (mean ± SE) in the right ventricle was robustly thicker in CCH (P < 0.05) and thicker, but to a much lesser extent, in CIH compared with NC. F: total protein/heart changes over time under NC, CCH, and CIH. Neonatal P2 mice (2nd day after birth) were weighed, and mice of similar weight were separated into 3 groups and treated under NC, CCH, or CIH. Hearts were obtained after 1, 2, and 4 wk of hypoxia, and total proteins were measured in individual hearts (n = 4). Hearts of mice treated with CCH contained much more protein compared with NC and CIH hearts at the same time points. G and H: heart weight (n = 8) was lower in CIH than in NC when 7.5% O2 rather than 11% O2 was applied. The size of cardiomyocytes in the transverse section was smaller than in NC after 1 wk of hypoxia exposure. Values are means ± SD. *P < 0.05 and **P < 0.01, CCH or CIH compared with NC.
Fig. 3
Fig. 3
A and B: profiles of gene expression in mouse heart subjected to CCH or CIH. More genes were upregulated in CCH, and more genes were downregulated in CIH. C and D: results of microarray and quantitative RT-PCR are consistent for 8 selected genes from mouse hearts at 2 wk after CCH or CIH treatment. Bnip3l, Slc6a8, and Slc12a2 were all upregulated in CCH and CIH. Note the opposite alterations of Madh4 and Solh in CCH- and CIH-treated hearts. E: percent differences between the fold change in male and female mice subjected for 1 wk to CIH plotted against the significant regulation ratios I1/N1 (negative values for downregulation) of the entire set of 4 mice. Note that no difference exceeds 50% of the average fold change for the entire set of 4 mice (meaning that both genders were regulated in the same sense), most of the differences do not exceed 25% (no statistically significant difference between the fold change in the 2 genders), and the approximate symmetry of the differences i.e., the no. of genes with a higher fold change in males than in females (points above the horizontal axis) is close to the no. of genes with a higher regulation in females than in males (points below the horizontal axis) for both types of regulations (upregulations in the positive side of the horizontal axis and downregulations in the negative one).
Fig. 4
Fig. 4
Alteration in gene expression and protein level of eukaryotic translation initiation factors (eIFs) after chronic hypoxia treatment. A: profiles of gene expression and regulation of eIFs in 4 individual mice subjected to normoxia (N1–N4), CCH (C1–C4), and CIH (I1–I4) for 1, 2, or 4 wk. Each value is represented by a colored square. Duration of the treatment is indicated before the letter of treatment, (e.g., 1I2 = 1 wk CIH, 2nd mouse), while the green/red color of the square shows down/upregulation, with brighter colors for higher regulation. Note both the variability and the reproducible pattern among the mice subjected to the same treatment. Note also the darker colors of the normoxic values, since they were closer to the average used in normalization. B: Western blot analysis of eIF-2α and phosphorylated eIF-2α (Ser52) in CCH, CIH, and age-matched NC. Results were reproduced in 3 independent experiments and averaged. C and D: statistical analysis (t-test) of densitometric analyses of Western results of eIF-2α and phosphorylated eIF-2α (Ser52). The y-axis depicts the relative protein expression level as a ratio of the protein to its HSC70 density per 40 μg of total protein. Values are means ± SD (n = 3). E: Western blot analysis of eIF-4E and phosphorylated eIF-4E (Ser209) in CCH, CIH, and age-matched NC. F and G: statistical analysis (t-test) of densitometric analyses of Western results of eIF-4E and phosphorylated eIF-4E (Ser209). *P < 0.05 compared with normoxic control. **P < 0.01 compared with normoxic control. †P < 0.01 compared with CIH.
Fig. 4
Fig. 4
Alteration in gene expression and protein level of eukaryotic translation initiation factors (eIFs) after chronic hypoxia treatment. A: profiles of gene expression and regulation of eIFs in 4 individual mice subjected to normoxia (N1–N4), CCH (C1–C4), and CIH (I1–I4) for 1, 2, or 4 wk. Each value is represented by a colored square. Duration of the treatment is indicated before the letter of treatment, (e.g., 1I2 = 1 wk CIH, 2nd mouse), while the green/red color of the square shows down/upregulation, with brighter colors for higher regulation. Note both the variability and the reproducible pattern among the mice subjected to the same treatment. Note also the darker colors of the normoxic values, since they were closer to the average used in normalization. B: Western blot analysis of eIF-2α and phosphorylated eIF-2α (Ser52) in CCH, CIH, and age-matched NC. Results were reproduced in 3 independent experiments and averaged. C and D: statistical analysis (t-test) of densitometric analyses of Western results of eIF-2α and phosphorylated eIF-2α (Ser52). The y-axis depicts the relative protein expression level as a ratio of the protein to its HSC70 density per 40 μg of total protein. Values are means ± SD (n = 3). E: Western blot analysis of eIF-4E and phosphorylated eIF-4E (Ser209) in CCH, CIH, and age-matched NC. F and G: statistical analysis (t-test) of densitometric analyses of Western results of eIF-4E and phosphorylated eIF-4E (Ser209). *P < 0.05 compared with normoxic control. **P < 0.01 compared with normoxic control. †P < 0.01 compared with CIH.
Fig. 5
Fig. 5
Alteration in proapoptotic and anti-apoptotic genes in CCH- and CIH-treated mouse heart. A and B: proapoptotic genes were mostly upregulated in CCH hearts, whereas the anti-apoptotic genes were dominantly upregulated in CIH-treated hearts. C: ratio of apoptotic nuclei to total nuclei shows that apoptotic nuclei were significantly increased in CCH-but remained unchanged in CIH-treated mouse hearts. After treatment with converter-alkaline phosphatase, the apoptotic nuclei could be detected as dark spots (arrows in E, F, G) under a light microscope: apoptotic nuclei are clearly seen in CCH-treated (E) but are rarely seen in age-matched NC (D) and CIH-treated (F) mouse hearts. In C, **P < 0.01 and +P < 0.05. G: positive control. A heart section from an NC mouse treated with DNase I. Many nuclei with fragmented DNA were labeled by TUNEL. H: fluorescent microscope picture of apoptotic nuclei in CCH that were stained with green fluorescein and colocalized with the nuclei dye DAPI (blue). Scale bars = 20 μm.

Similar articles

Cited by

References

    1. Arsham AM, Howell JJ, Simon MC. A novel hypoxia-inducible factor-independent hypoxic response regulating mammalian target of rapamycin and its targets. J Biol Chem. 2003;278:29655–29660. - PubMed
    1. Ashburner M, Ball CA, Blake JA, Botstein D, Butler H, Cherry JM, Davis AP, Dolinski K, Dwight SS, Eppig JT, Harris MA, Hill DP, Issel-Tarver L, Kasarskis A, Lewis S, Matese JC, Richardson JE, Ringwald M, Rubin GM, Sherlock G. Gene Ontology: tool for the unification of biology. Nat Genet. 2000;25:25–29. - PMC - PubMed
    1. Brand-Schieber E, Werner P, Iacobas DA, Iacobas S, Beelitz M, Lowery SL, Spray DC, Scemes S. Connexin43, the major gap junction protein of astrocytes, is down-regulated in inflamed white matter in an animal model of multiple sclerosis. J Neurosci Res. 2005;80:798–808. - PMC - PubMed
    1. Clemens MJ. Translational regulation in cell stress and apoptosis. Roles of the eIF4E binding proteins. J Cell Mol Med. 2001;5:221–239. - PMC - PubMed
    1. Dahlquist KD, Salomonis N, Vranizan K, Lawlor SC, Conklin BR. GenMAPP, a new tool for viewing and analyzing microarray data on biological pathways. Nat Genet. 2002;31:19–20. - PubMed

Publication types

MeSH terms