. 2005 Jun;125(6):535-53.
doi: 10.1085/jgp.200409216.

The frequency of calcium oscillations induced by 5-HT, ACH, and KCl determine the contraction of smooth muscle cells of intrapulmonary bronchioles

Affiliations

The frequency of calcium oscillations induced by 5-HT, ACH, and KCl determine the contraction of smooth muscle cells of intrapulmonary bronchioles

Jose F Perez et al. J Gen Physiol. 2005 Jun.

Abstract

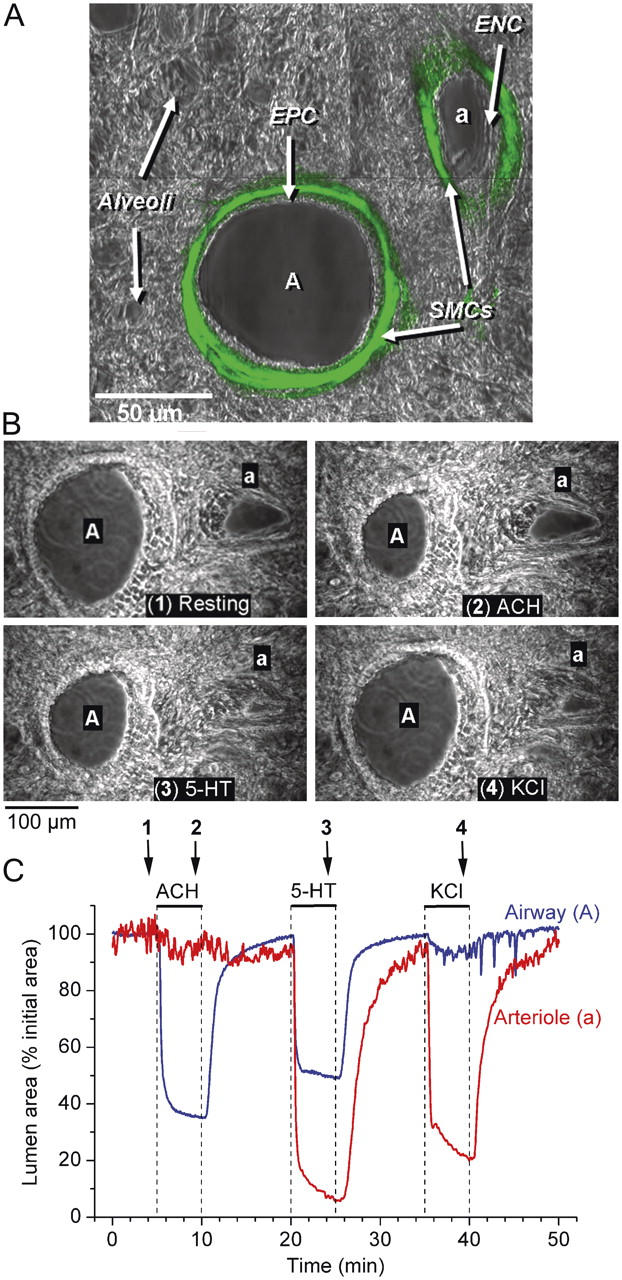
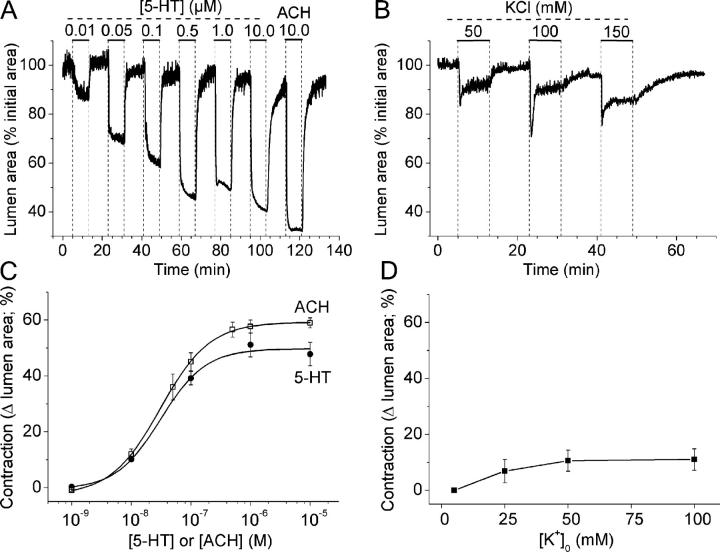
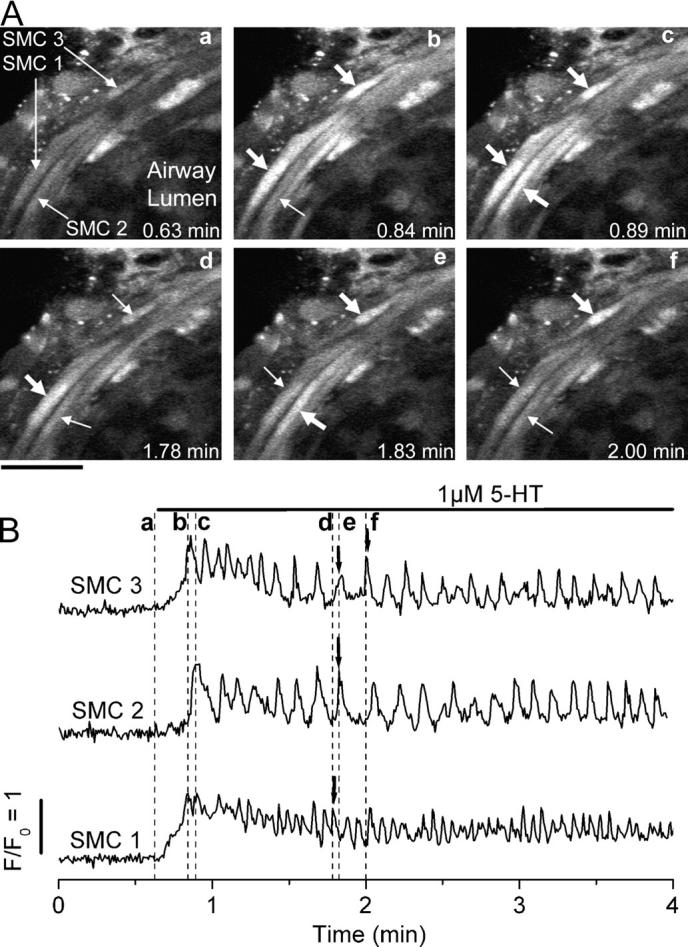
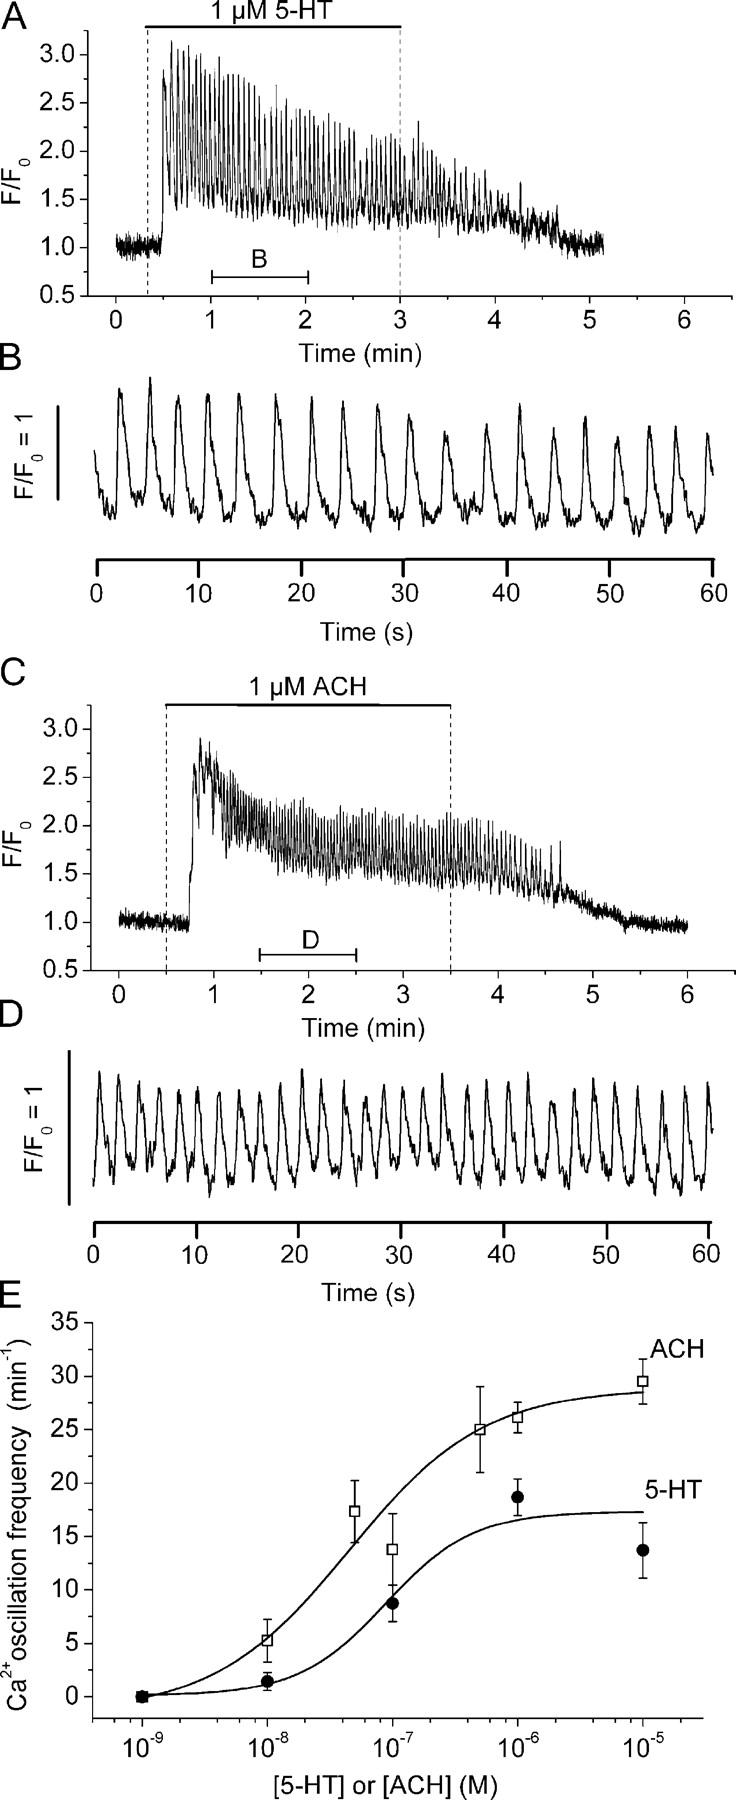
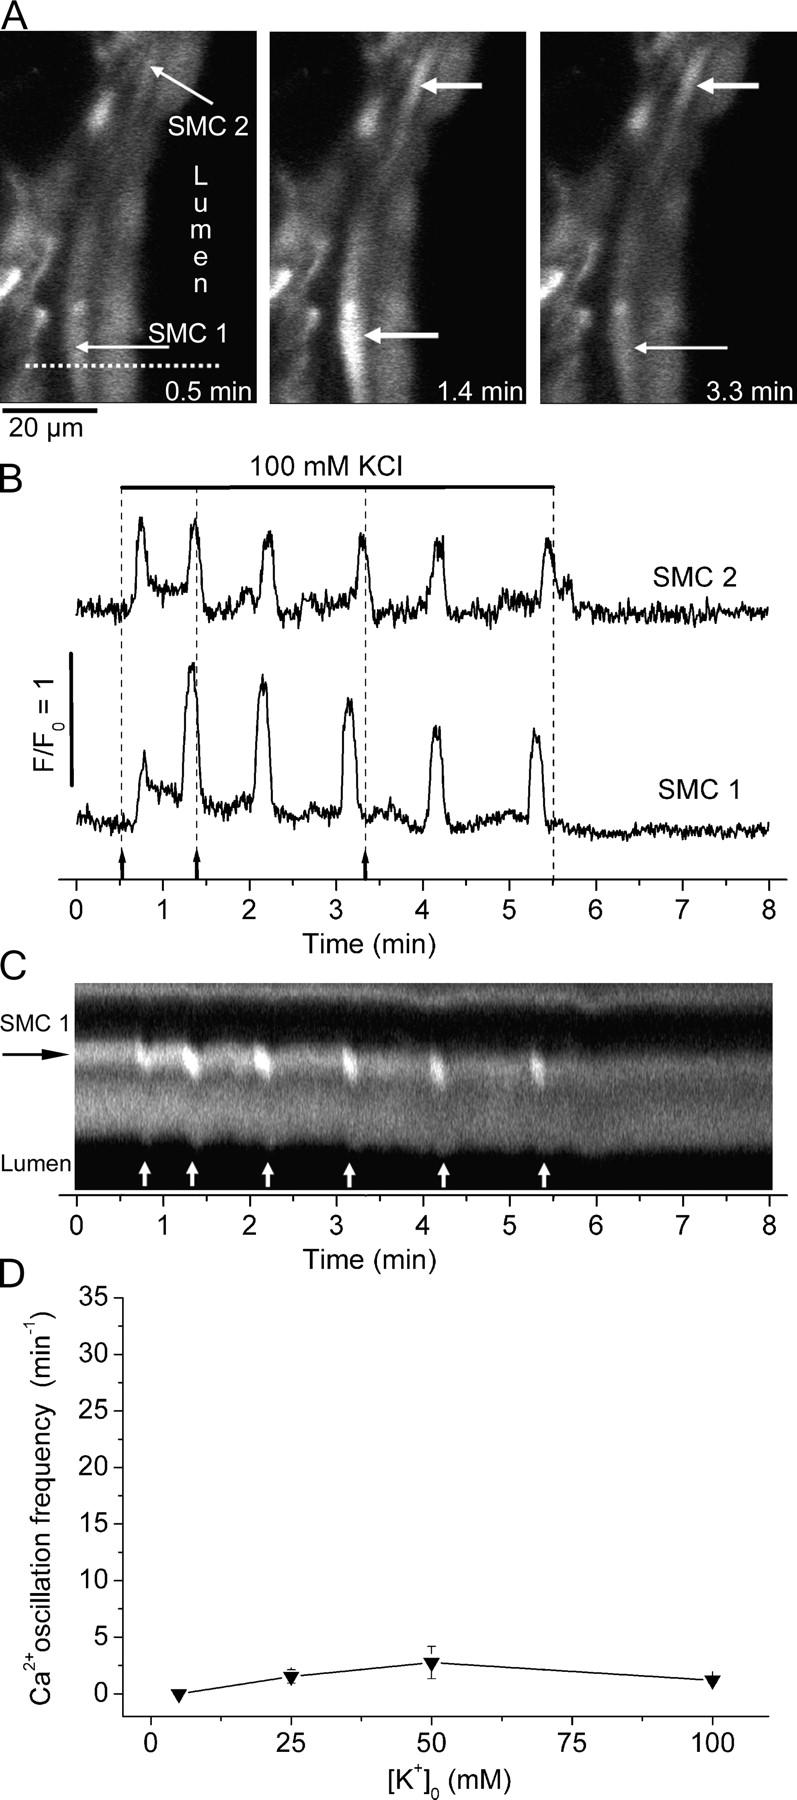
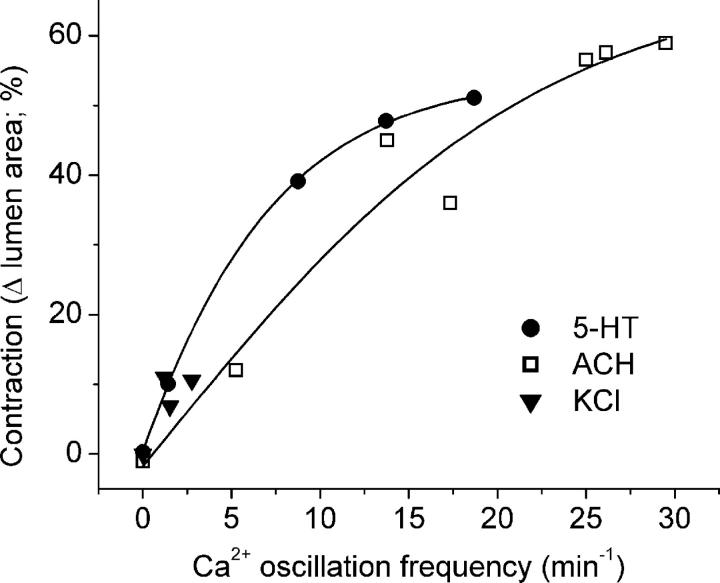
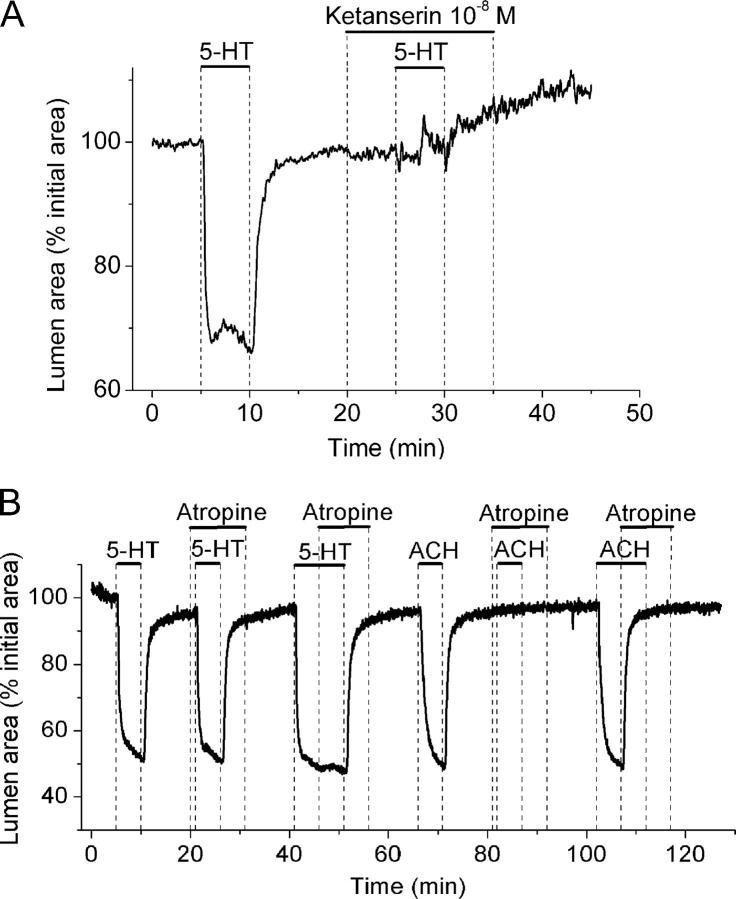
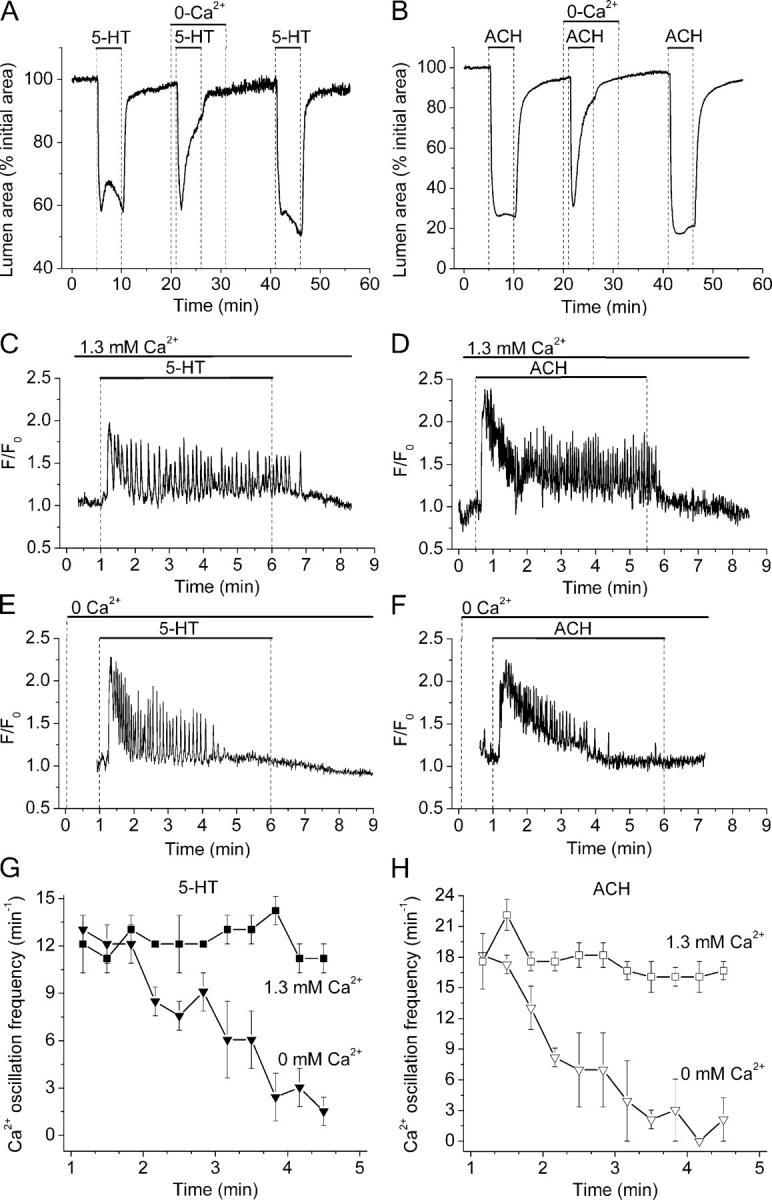
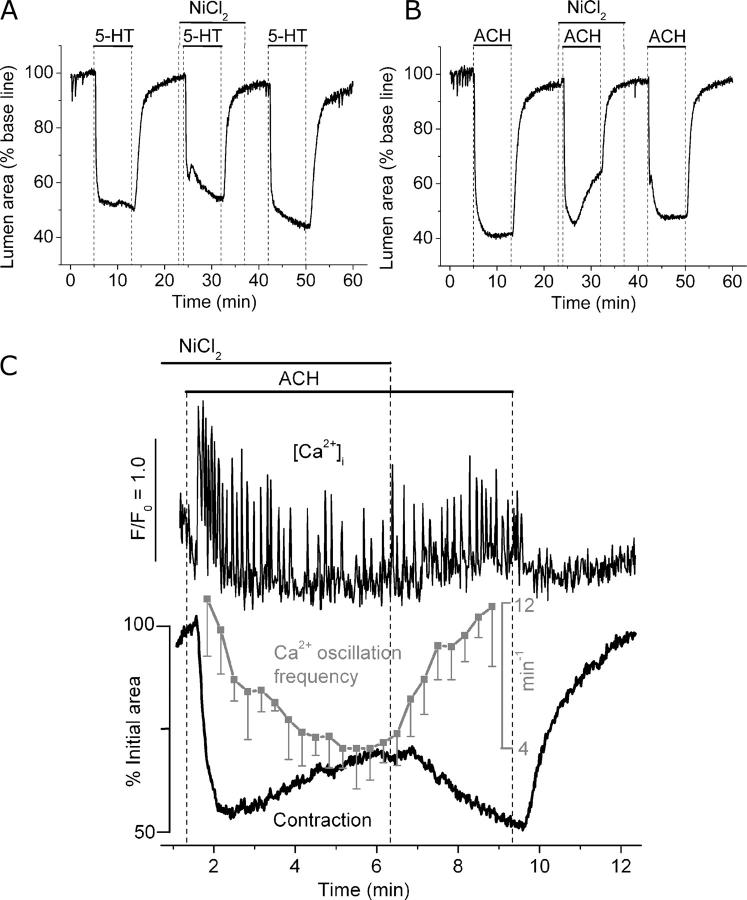
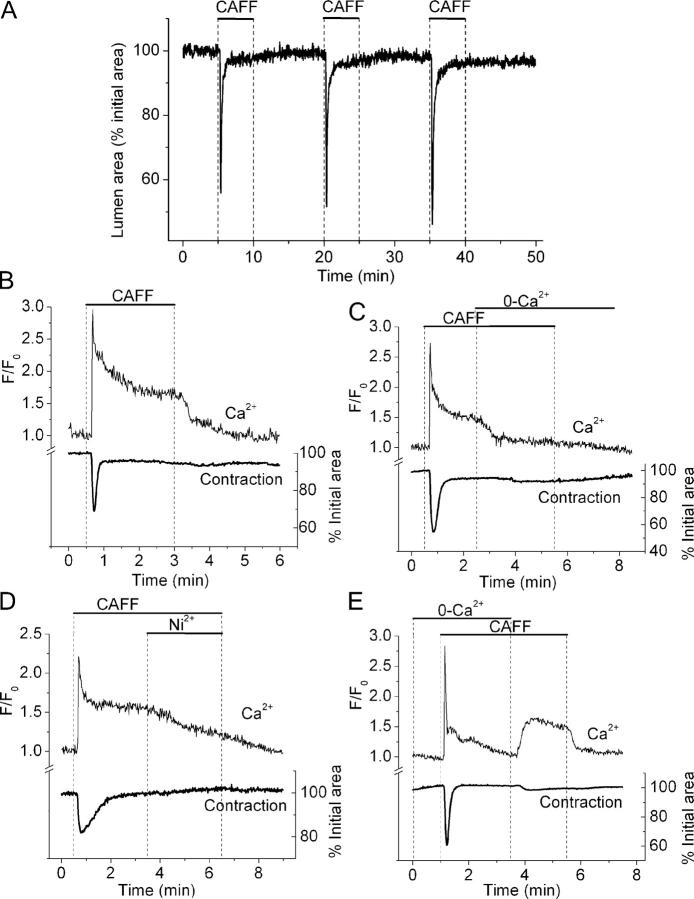
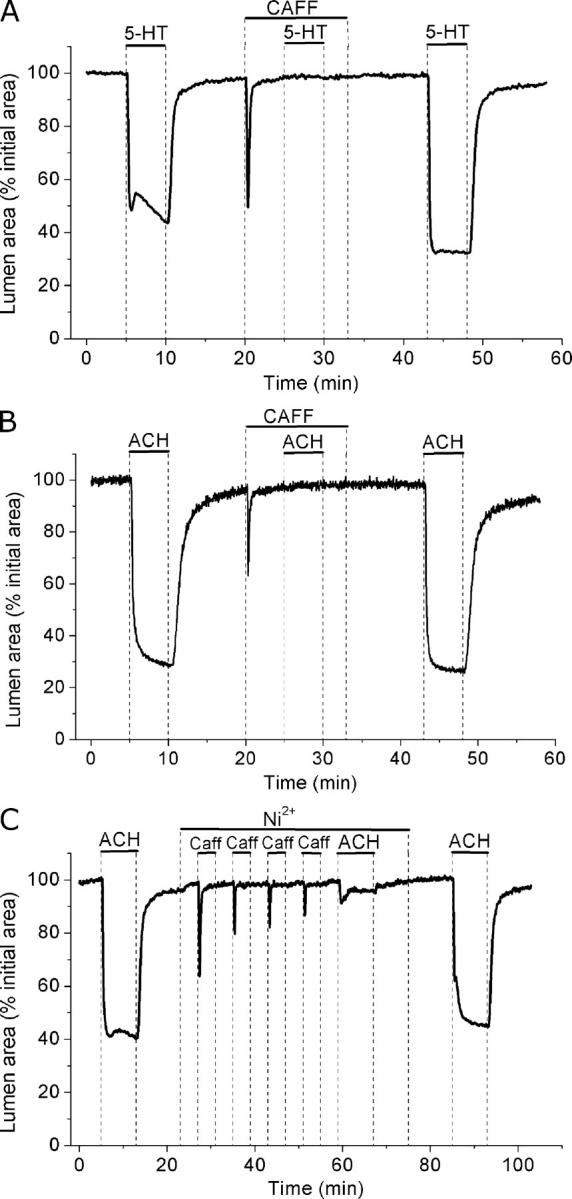
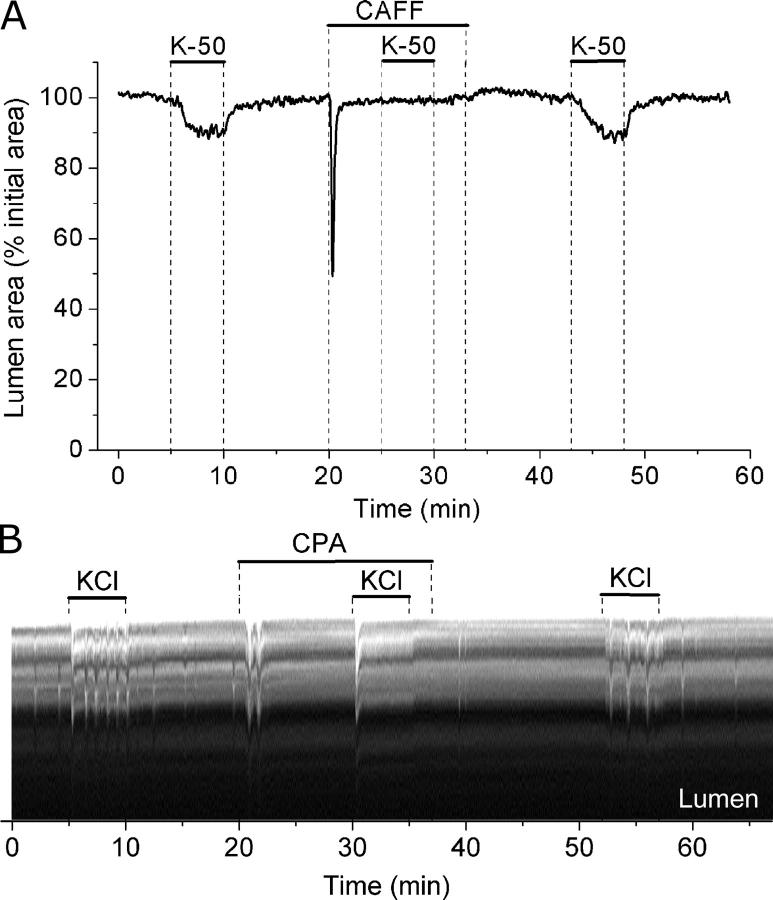
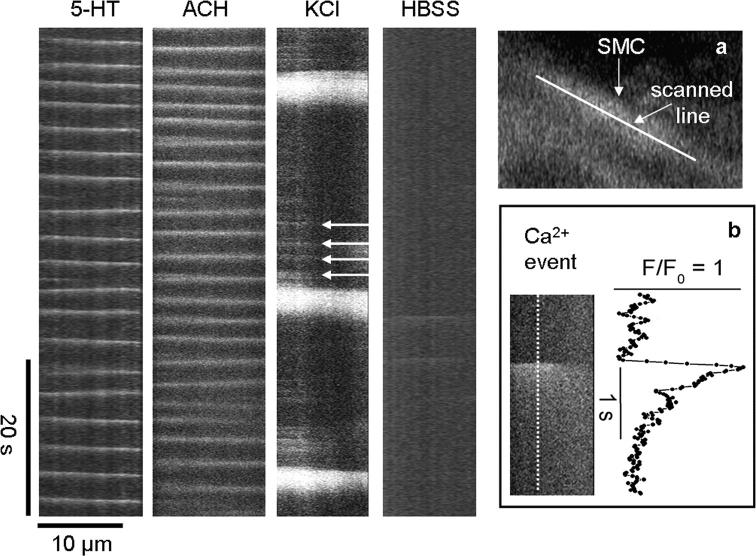
Increased resistance of airways or blood vessels within the lung is associated with asthma or pulmonary hypertension and results from contraction of smooth muscle cells (SMCs). To study the mechanisms regulating these contractions, we developed a mouse lung slice preparation containing bronchioles and arterioles and used phase-contrast and confocal microscopy to correlate the contractile responses with changes in [Ca(2+)](i) of the SMCs. The airways are the focus of this study. The agonists, 5-hydroxytrypamine (5-HT) and acetylcholine (ACH) induced a concentration-dependent contraction of the airways. High concentrations of KCl induced twitching of the airway SMCs but had little effect on airway size. 5-HT and ACH induced asynchronous oscillations in [Ca(2+)](i) that propagated as Ca(2+) waves within the airway SMCs. The frequency of the Ca(2+) oscillations was dependent on the agonist concentration and correlated with the extent of sustained airway contraction. In the absence of extracellular Ca(2+) or in the presence of Ni(2+), the frequency of the Ca(2+) oscillations declined and the airway relaxed. By contrast, KCl induced low frequency Ca(2+) oscillations that were associated with SMC twitching. Each KCl-induced Ca(2+) oscillation consisted of a large Ca(2+) wave that was preceded by multiple localized Ca(2+) transients. KCl-induced responses were resistant to neurotransmitter blockers but were abolished by Ni(2+) or nifedipine and the absence of extracellular Ca(2+). Caffeine abolished the contractile effects of 5-HT, ACH, and KCl. These results indicate that (a) 5-HT and ACH induce airway SMC contraction by initiating Ca(2+) oscillations, (b) KCl induces Ca(2+) transients and twitching by overloading and releasing Ca(2+) from intracellular stores, (c) a sustained, Ni(2+)-sensitive, influx of Ca(2+) mediates the refilling of stores to maintain Ca(2+) oscillations and, in turn, SMC contraction, and (d) the magnitude of sustained airway SMC contraction is regulated by the frequency of Ca(2+) oscillations.


Figures

F<sc>igure</sc> 1.
Figure 1.
The localization of SMCs and the contractile responses of an airway and arteriole in a lung slice induced by ACH, 5-HT, and KCl. (A) A lung slice was fixed and stained with FITC-conjugated antibodies against smooth muscle α-actin. Fluorescence and phase-contrast images were recorded with a confocal microscope. The fluorescence image was assigned a green pseudo-color and superimposed on the phase-contrast image to show colocalization. The final image consists of a montage of six different images. The bronchiole airway (A) and the accompanying arteriole (a) are surrounded by alveolar parenchyma. A prominent layer of SMCs (green) is located below the epithelial (EPC) and endothelial (ENC) cells of the bronchiole and arteriole, respectively. (B) A series of phase-contrast images, recorded at different times (indicated by arrows in C) showing the appearance of an airway and arteriole before (1) and after stimulation with 1 μM ACH (2), 1 μM 5-HT (3), and 100 mM KCl (4). (C) The cross-sectional area of the lumen of an airway (blue line) and arteriole (red line) with respect to time in response to ACH, 5-HT, and KCl (top bars). ACH induced a contraction of the airway but not of the arteriole. 5-HT induced a greater contraction in the arteriole than in the airway. KCl induced twitching in both the airway and arteriole and a sustained contraction of the arteriole. Upon washout of agonists or KCl, the airway and arteriole relaxed. A movie of these data is shown in Video 1 (available at http://www.jgp.org/cgi/content/full/jgp.200409216/DC1). Representative experiment of six different slices from three mice.
F<sc>igure</sc> 2.
Figure 2.
The effect of concentration on 5-HT–, ACH-, and KCl-induced airway contraction. Lung slices with airways of similar sizes were stimulated with increasing concentrations of 5-HT, ACH, or KCl (perfusion time of 8 min). Relaxation of the airways between exposure to agonists or KCl was achieved by washing with sHBSS for 10 min. An image was recorded every 2 s and the airway lumen cross-sectional area was calculated and plotted with respect to time. (A) 5-HT induced a concentration-dependent increase in the contraction of airways in the range of 0.01–0.5 μM. Stimulation with 10 μM ACH induced a larger contraction as compared with 10 μM 5-HT. (B) A representative experiment showing the effect of increasing isotonic concentrations of KCl on the contraction of airways. (C and D) Summary of the concentration-dependent contractility of the airways to (C) ACH (open squares) and 5-HT (closed circles) or (D) KCl, calculated after 5 min of agonist or KCl exposure. Each point represents the mean ± SEM from at least three different experiments on different slices from at least two mice. For each agonist, the contractility data were fitted with a logistic function curve.
F<sc>igure</sc> 3.
Figure 3.
Ca2+ signaling induced by 5-HT in airway SMCs in lung slices. (A) Selected images recorded at times indicated in each panel (a–f) (and dashed lines in B) during the exposure to 5-HT. Bar, 20 μm. The responses of three different SMCs (indicated by arrows in a) are highlighted. After stimulation with 1 μM 5-HT, the fluorescence in each SMC increases and begins to oscillate asynchronously (thick arrows, b–f) above the basal level (thin arrows). Due to airway contraction, the cells are displaced toward the bottom right. (B) In all three airway SMCs, the Ca2+ signaling induced by 5-HT was characterized by an initial increase in [Ca2+]i followed by Ca2+ oscillations. Fluorescence images were recorded at 2 Hz. The fluorescence changes from small ROIs (∼5 × 5 pixels), as defined in the SMCs as indicated in A, a, were plotted as a ratio (Ft/F0) with respect to time. A representative experiment of at least five trials from different slices from three mice is shown. A movie showing the effect of 5-HT on Ca2+ signaling in airway SMCs is shown in Video 2 (available at http://www.jgp.org/cgi/content/full/jgp.200409216/DC1).
F<sc>igure</sc> 4.
Figure 4.
Comparison of Ca2+ oscillations induced by 5-HT and ACH in airway SMCs. Airway SMCs of lung slices stimulated with (A) 1 μM 5-HT or (C) 1 μM ACH. The Ca2+ responses to these agonists were characterized by an increase in [Ca2+]i followed by Ca2+ oscillations that persisted until the removal of the agonist. (B and D) An expanded region of 1 min, indicated by the lower bar in A and C, to show the details of the Ca2+ oscillations induced by each agonist. Representative traces of at least three experiments from different slices from two mice. A movie of the first 1 min after stimulation with 5-HT is shown in Video 3 (available at http://www.jgp.org/cgi/content/full/jgp.200409216/DC1). (E) Concentration–response curves for the frequency of Ca2+ oscillations induced by 5-HT (solid circles) and ACH (open squares). Changes in [Ca2+]i were determined in single SMCs for each agonist concentration in separate experiments. Each point represents the mean ± SEM from at least five different cells from different slices from at least two mice. Data points of 5-HT and ACH were each fitted with a logistic function curve.
F<sc>igure</sc> 5.
Figure 5.
Ca2+ signaling induced by KCl in airway SMCs. (A) Selected images taken at different times (indicated in B by arrows and dashed lines) during the exposure to 100 mM KCl (bar) showing two cells responding with transient increases in [Ca2+]i (thick arrows) over a basal level (thin arrows). (B) Fluorescence changes acquired from a 5 × 5 pixel ROI within each SMC indicated in A showing the Ca2+ oscillations induced by KCl. (C) A line-scan plot, from the dotted line indicated in A, showing the Ca2+ oscillations induced by KCl in SMC 1 (white lines) and the accompanying transient contraction (downward deflections, arrows) toward the lumen (lower black area). (D) Concentration–response curve for the frequency of Ca2+ oscillations induced by KCl. Each point represents the mean ± SEM from six different cells from three different slices from three mice. Data points were joined with a straight line. A movie of the effect of KCl is shown in Video 4 (available at http://www.jgp.org/cgi/content/full/jgp.200409216/DC1).
F<sc>igure</sc> 6.
Figure 6.
Relationship between Ca2+ oscillation frequency and airway contraction induced by 5-HT, ACH, and KCl. Data from concentration–response curves of the frequency of the Ca2+ oscillations and the contractility for each agonist were replotted. Data were fitted with a sigmoidal curve (Boltzmann). For ACH (open squares) and 5-HT (filled circles), the airway contraction increases as a saturating function of the frequency of the Ca2+ oscillations. The low frequency Ca2+ oscillations induced by KCl (filled triangles) induced only a small contraction.
F<sc>igure</sc> 7.
Figure 7.
Type of receptor involved in the contraction of airways induced by 5-HT. (A) An airway sequentially stimulated with 1 μM 5-HT in the absence or presence of 10−8 M ketanserin (a specific 5-HT2 antagonist) as indicated by bars. (B) An airway sequentially stimulated with 1 μM 5-HT and 1 μM ACH in the absence or presence of 1 μM atropine as indicated by top bars. Atropine has no effect on 5-HT–induced airway contraction but completely blocked or relaxed ACH-induced contraction. Representative traces of at least three different slices from three mice.
F<sc>igure</sc> 8.
Figure 8.
Role of extracellular Ca2+ during the contraction and the Ca2+ signaling of airway SMCs induced by 5-HT and ACH. (A and B) Contractile responses of airways in different lung slices sequentially exposed (top bars) to 1 μM 5-HT and 1 μM ACH in the presence or absence of extracellular Ca2+. Representative traces of five airways from three mice. (C–H) The changes in [Ca2+]i in small ROIs of single SMCs were determined in lung slices stimulated with (C, E, and G) 1 μM 5-HT or (D, F, and H) 1 μM ACH in the (C and D) presence or (E and F) absence of extracellular Ca2+ as indicated by top bars. In the absence or presence of extracellular Ca2+, both agonists induced an increase in [Ca2+]i followed by Ca2+ oscillations. Although Ca2+ oscillations persisted in the presence of extracellular Ca2+, they progressively reduce their frequency and stopped in the absence of extracellular Ca2+. (G and H) The frequency of agonist-induced Ca2+ oscillations, calculated every 20 s, in the presence (squares) or absence of Ca2+ (triangles) with respect to time. Symbols and bars are the mean ± SEM of five to eight SMCs in five paired experiments from different lung slices from three mice.
F<sc>igure</sc> 9.
Figure 9.
Effect of Ni2+ on Ca2+ signaling and contraction induced by 5-HT and ACH. (A and B) Airways were sequentially stimulated with (A) 1 μM 5-HT or (B) 1 μM ACH in the absence or presence of 1 mM NiCl2 (top bars). Representative traces of at least four experiments from different slices from three mice. (C) Simultaneous recordings of changes in [Ca2+]i (top trace) in single SMCs and contraction of the airway lumen (bottom black trace) during the stimulation with ACH in the presence or absence of 1 mM NiCl2 as indicated by top bars. The frequency of the agonist-induced Ca2+ oscillations (gray trace) was calculated every 20 s. Symbols and bars are the mean ± SEM of six SMCs in five experiments from different lung slices from two mice.
F<sc>igure</sc> 10.
Figure 10.
Ca2+ signaling and contraction induced by caffeine in airway SMCs. (A) Repetitive contractile responses of an airway to sequential stimulation with 20 mM caffeine as indicated by top bars. (B, C, D, and E) Simultaneous recordings of changes in [Ca2+]i in single SMCs and contraction of the airway lumen during the stimulation with 20 mM caffeine in the presence or absence of extracellular Ca2+ or 1 mM NiCl2 as indicated by top bars. Representative traces of at least four experiments from different slices of two mice.
F<sc>igure</sc> 11.
Figure 11.
Effect of caffeine on airway contraction induced by 5-HT and ACH. Airways in lung slices were sequentially stimulated with (A) 1 μM 5-HT or (B) 1 μM ACH in the absence or presence of 20 mM caffeine (top bars). (C) The effect of depletion of internal stores on the response to 1 μM ACH induced by successive stimulation with 20 mM caffeine in the presence of 1 mM Ni2+. Representative traces of at least three experiments from different slices from two mice.
F<sc>igure</sc> 12.
Figure 12.
Effect of caffeine and CPA on airway contraction induced by KCl. (A) Airways were sequentially stimulated with 50 mM KCl in the absence or presence of 20 mM caffeine (top bars). (B) A line-scan obtained from phase-contrast images in a region similar to that shown by the dotted line in Fig. 5 A during sequential stimulation with KCl in the absence or presence of 10 μM CPA (top bars). Twitches induced by KCl are observed as transient signals toward the lumen of the airway and represent the local displacement of cells produced by the contraction of one or a few SMCs. A few spontaneous twitches were observed before exposure to KCl. Representative data of at least four experiments from different slices from three mice.
F<sc>igure</sc> 13.
Figure 13.
Ca2+ waves and elemental Ca2+ events in airway SMCs during the stimulation with 5-HT, ACH, and KCl. Line scans from the longitudinal axes of single airway SMCs (inset, a) from high speed recordings (60 fps) of changes in Ca2+ during continuous perfusion with 1 μM 5-HT, 1 μM ACH, and 50 mM KCl and after removal of KCl by washing with HBSS, as indicated. The slopes of the white lines indicate the velocity (μm/s) and direction of the Ca2+ waves in the SMCs. KCl induce small Ca2+ events (arrows) preceding the Ca2+ wave. (Inset, b) An expanded view of a single Ca2+ event (image and trace) induced by KCl. Representative traces of at least four experiments from different slices of two mice.

Comment in

  • Imaging dynamic cellular events in the lung.
    Kotlikoff MI, Tallini NY. Kotlikoff MI, et al. J Gen Physiol. 2005 Jun;125(6):529-30. doi: 10.1085/jgp.200509322. J Gen Physiol. 2005. PMID: 15928399 Free PMC article. No abstract available.

Similar articles

Cited by

References

    1. Abdullah, N.A., M. Hirata, K. Matsumoto, H. Aizawa, R. Inoue, S. Hamano, S. Ikeda, Z. Xie, N. Hara, and Y. Ito. 1994. Contraction and depolarization induced by fetal bovine serum in airway smooth muscle. Am. J. Physiol. 266:L528–L535. - PubMed
    1. Adler, A., E.A. Cowley, J.H. Bates, and D.H. Eidelman. 1998. Airway-parenchymal interdependence after airway contraction in rat lung explants. J. Appl. Physiol. 85:231–237. - PubMed
    1. Adriaensen, D., I. Brouns, J. Van Genechten, and J.P. Timmermans. 2003. Functional morphology of pulmonary neuroepithelial bodies: extremely complex airway receptors. Anat. Rec. A Discov. Mol. Cell Evol. Biol. 270:25–40. - PubMed
    1. Ay, B., Y.S. Prakash, C.M. Pabelick, and G.C. Sieck. 2004. Store-operated Ca2+ entry in porcine airway smooth muscle. Am. J. Physiol. Lung Cell. Mol. Physiol. 286:L909–L917. - PubMed
    1. Ben-Harari, R.R., A. Parent Ermini, and J. Kleinerman. 1990. Metabolism of 5-hydroxytryptophan in the isolated perfused rat lung. Pharmacology. 41:272–279. - PubMed

Publication types

MeSH terms