. 2005 Jun;125(6):587-600.
doi: 10.1085/jgp.200509264.

Ethanol modulates the VR-1 variant amiloride-insensitive salt taste receptor. II. Effect on chorda tympani salt responses

Affiliations

Ethanol modulates the VR-1 variant amiloride-insensitive salt taste receptor. II. Effect on chorda tympani salt responses

Vijay Lyall et al. J Gen Physiol. 2005 Jun.

Abstract

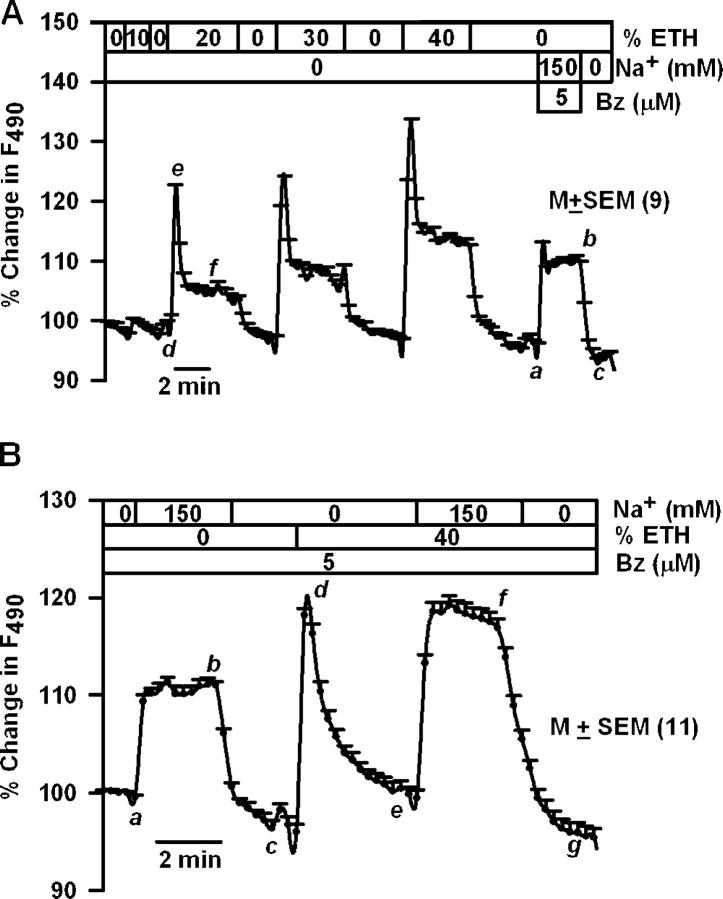
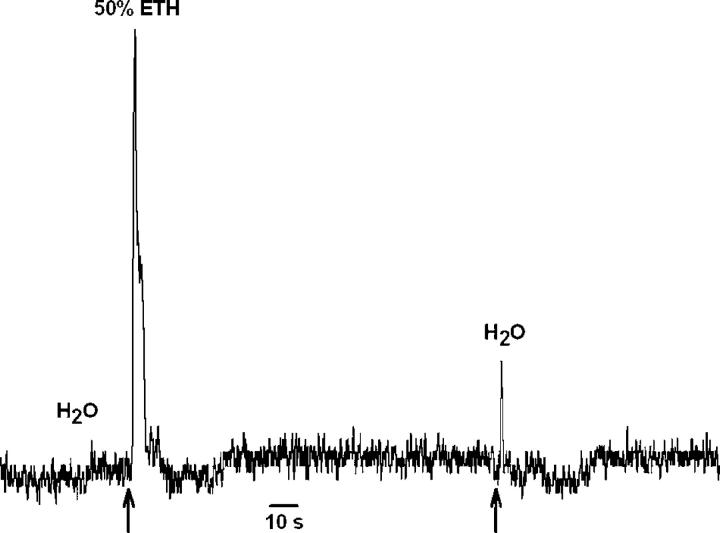
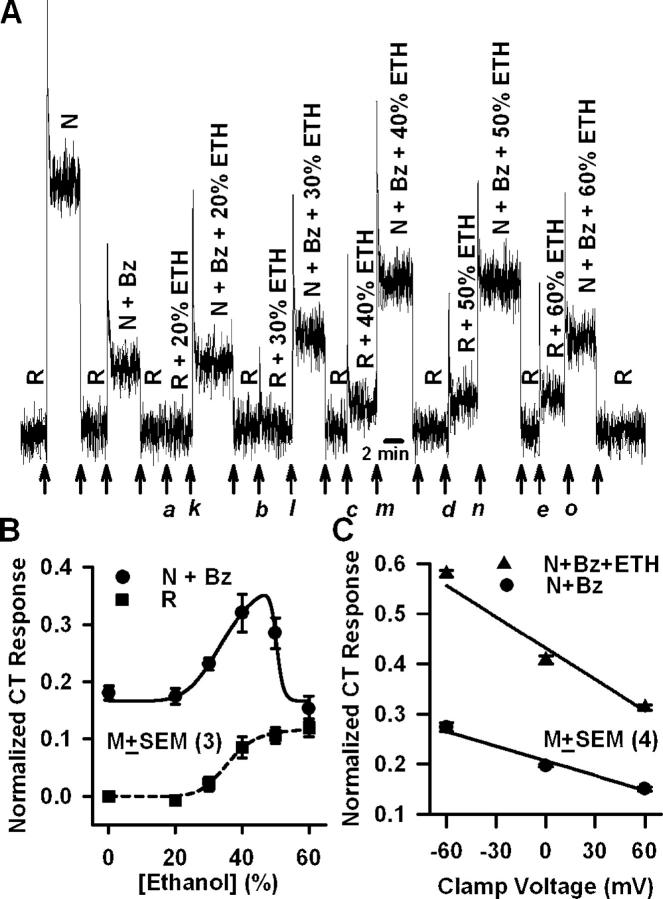
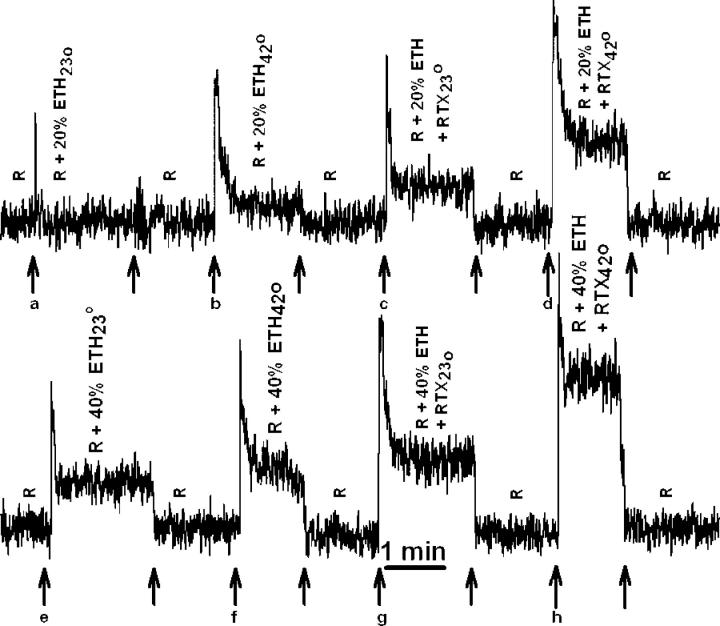
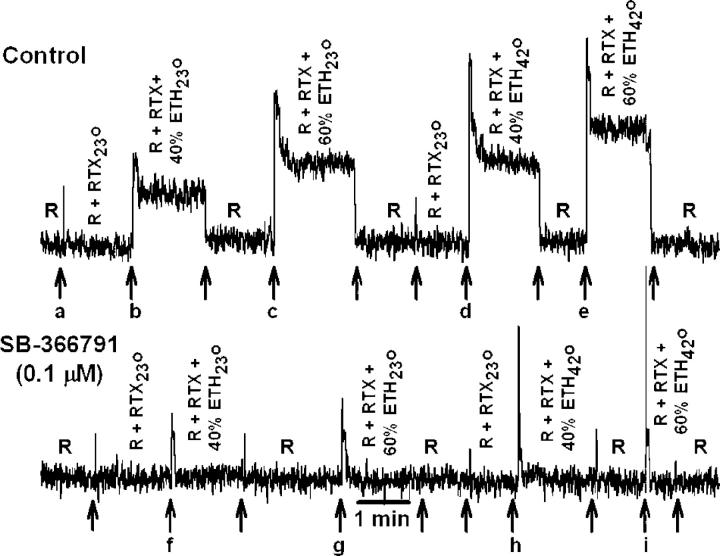
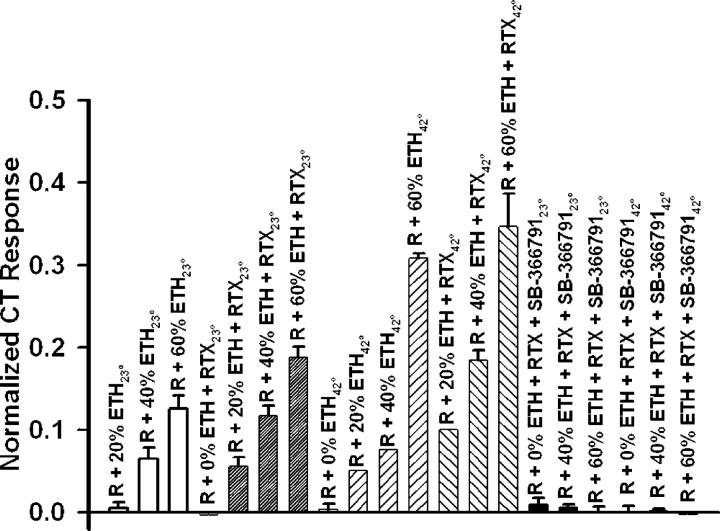
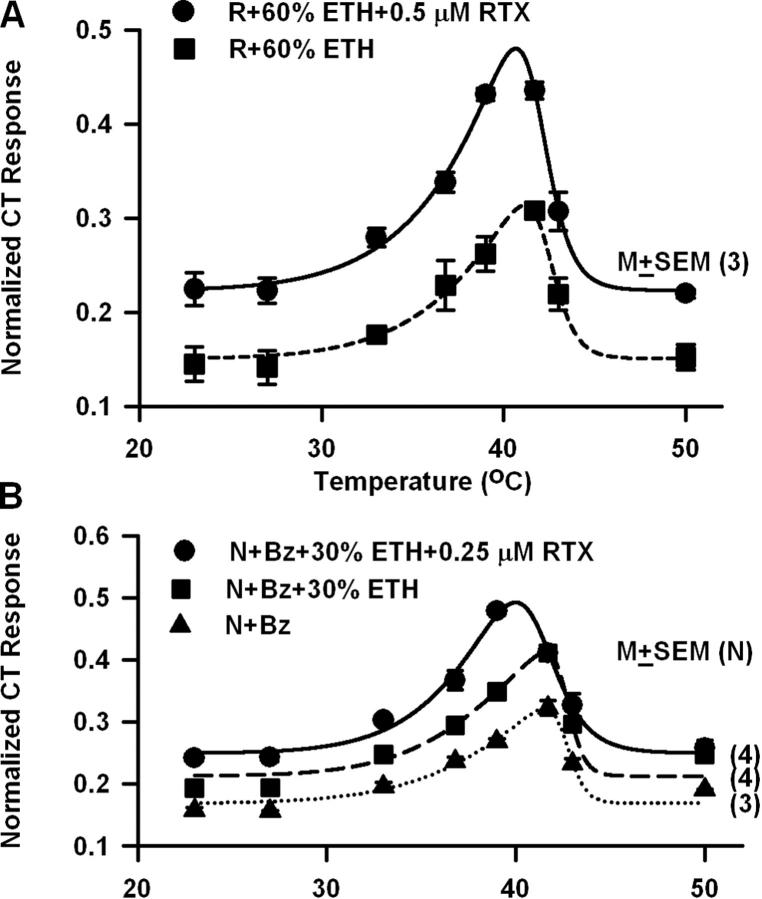
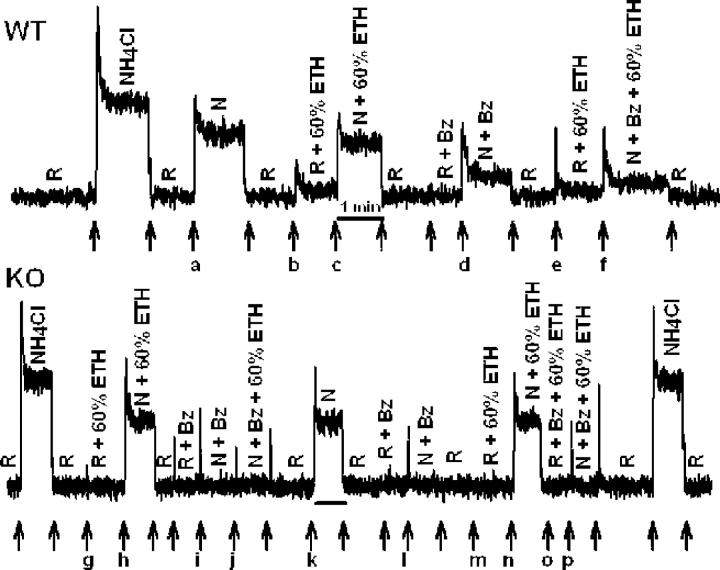
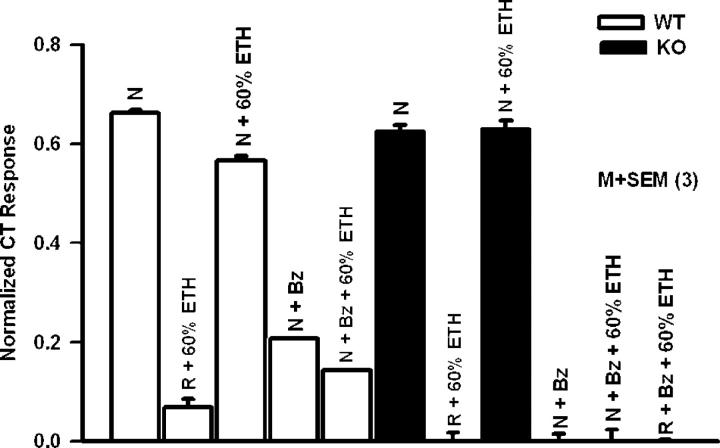
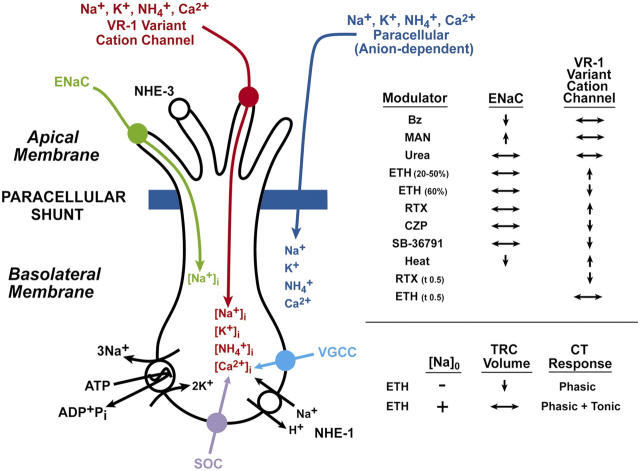
The effect of ethanol on the amiloride- and benzamil (Bz)-insensitive salt taste receptor was investigated by direct measurement of intracellular Na(+) activity ([Na(+)](i)) using fluorescence imaging in polarized fungiform taste receptor cells (TRCs) and by chorda tympani (CT) taste nerve recordings. CT responses to KCl and NaCl were recorded in Sprague-Dawley rats, and in wild-type (WT) and vanilloid receptor-1 (VR-1) knockout mice (KO). CT responses were monitored in the presence of Bz, a specific blocker of the epithelial Na(+) channel (ENaC). CT responses were also recorded in the presence of agonists (resiniferatoxin and elevated temperature) and antagonists (capsazepine and SB-366791) of VR-1 that similarly modulate the Bz-insensitive VR-1 variant salt taste receptor. In the absence of mineral salts, ethanol induced a transient decrease in TRC volume and elicited only transient phasic CT responses. In the presence of mineral salts, ethanol increased the apical cation flux in TRCs without a change in volume, increased transepithelial electrical resistance across the tongue, and elicited CT responses that were similar to salt responses, consisting of both a phasic component and a sustained tonic component. At concentrations <50%, ethanol enhanced responses to KCl and NaCl, while at ethanol concentrations >50%, those CT responses were inhibited. Resiniferatoxin and elevated temperature increased the sensitivity of the CT response to ethanol in salt-containing media, and SB-366791 inhibited the effect of ethanol, resiniferatoxin, and elevated temperature on the CT responses to mineral salts. VR-1 KO mice demonstrated no Bz-insensitive CT response to NaCl and no sensitivity to ethanol. We conclude that ethanol increases salt taste sensitivity by its direct action on the Bz-insensitive VR-1 variant salt taste receptor.


Figures

F<sc>igure</sc> 1.
Figure 1.
Effect of ethanol on TRC [Na+]i. A polarized epithelial preparation was initially perfused on both sides with 0 Na+-Ringer's solution containing 150 mM NMDG-Cl (pH 7.4). (A) Temporal changes in F490 of Na-green–loaded TRCs were monitored while the apical membrane was perfused with 0 Na+-Ringer's solution containing 10, 20 (def), 30, 40% ETH and with Ringer's solution containing 150 mM NaCl + 5 μM Bz (abc). (B) Temporal changes in F490 of Na-green–loaded TRCs were monitored while the apical membrane was perfused with Ringer's solution containing 150 mM NaCl + 5 μM Bz (abc), 0 Na+ Ringer's solution containing 40% ETH (cde), and with Ringer's solution containing 150 mM NaCl + 5 μM Bz + 40% ETH (efg). The relative changes in [Na+]i are presented as percent changes in F490 relative to bilateral 0 Na+ and are expressed as mean ± SEM of n, where n = number of regions of interest within the taste bud.
F<sc>igure</sc> 2.
Figure 2.
Effect of ethanol on the CT responses. Rat tongue was stimulated with 50% ethanol (50% ETH), and CT responses were recorded with reference to H2O rinse at 23°C. The time period at which the tongue was superfused with different solutions is indicated by arrows.
F<sc>igure</sc> 3.
Figure 3.
Effect of ethanol on the CT response in the presence of mineral salts. (A) Rat tongue was stimulated with ethanol (ETH; 20–60%) solutions containing either 10 mM KCl (R), 100 mM NaCl + 10 mM KCl (N), or 100 mM NaCl + 10 mM KCl + 5 μM Bz (N + Bz) maintained at room temperature (23°C). The time period at which the rat tongue was superfused with different solutions is indicated by arrows. The magnitude of the net NaCl CT response was obtained by the difference between the stimulating solution (N + Bz + ETH) and the corresponding rinse solution (R + ETH) at a specific ETH concentration. (B) The mean ± SEM values of the CT responses from three animals (N) are plotted as a function of ethanol concentration. (C) CT responses were recorded during superfusion of the tongue with R and then with N + Bz or with N + Bz + 40% ETH at zero current clamp and at −60 and +60 mV lingual voltage clamp. In each case the NaCl CT responses were normalized to the corresponding CT responses obtained with 300 mM NH4Cl. Each point represents the mean ± SEM of four animals.
F<sc>igure</sc> 4.
Figure 4.
Effect of ETH, elevated temperature, and RTX on the CT responses to 10 mM KCl. Rat tongue was stimulated with 10 mM KCl (R), 10 mM KCl + ETH (R + ETH), or 10 mM KCl + ETH + 0.5 μM RTX (R + ETH + RTX). The ETH concentration was either 20 or 40%. CT responses were monitored at 23°C or 42°C. The time period at which the rat tongue was superfused with different solutions is indicated by arrows.
F<sc>igure</sc> 5.
Figure 5.
Effect of SB-366719 on the CT responses to 10 mM KCl. Rat tongue was stimulated with 10 mM KCl (R), 10 mM KCl + 0.5 μM RTX (R + RTX), or 10 mM KCl + 0.5 μM RTX + ETH (R + ETH + RTX). The ETH concentration was either 40 or 60%. The time period at which the rat tongue was superfused with different solutions is indicated by arrows. CT responses were monitored at 23°C or 42°C in the absence (Control) and presence of 0.1 μM SB-366791.
F<sc>igure</sc> 6.
Figure 6.
Effect of ETH, temperature, RTX, and SB-366719 on the CT responses to 10 mM KCl. Summary of data from experiments shown in Figs. 4 and 5. Each bar represents the mean ± SEM of the normalized CT response from three animals (N).
F<sc>igure</sc> 7.
Figure 7.
Effect of temperature on the CT response to mineral salts. (A) CT responses were monitored while the rat tongues were first rinsed with 10 mM KCl (R) at 23°C and then stimulated with 10 mM KCl + 60% ETH (R + 60% ETH) or 10 mM KCl + 60% ETH + 0.5 μM RTX (R + 60% ETH + 0.5 μM RTX) maintained at temperatures between 23°C and 55.5°C. (B) CT responses were monitored while the rat tongues were first rinsed with 10 mM KCl (R) at 23°C and then stimulated with 10 mM KCl + 100 mM NaCl + 5 μM Bz (N + Bz), 10 mM KCl + 100 mM NaCl + 5 μM Bz + 30% ETH (N + Bz + 30% ETH), or 10 mM KCl + 100 mM NaCl + 5 μM Bz + 30% ETH + 0.25 μM RTX (N + Bz + 30% ETH + 0.25 μM RTX) maintained at temperatures between 23°C and 55.5°C. The values are expressed as mean ± SEM from three animals (N). Fitted curves in each case were drawn using Eq. 1.
F<sc>igure</sc> 8.
Figure 8.
Effect of ETH on the CT responses in WT and VR-1 KO mice. CT responses were monitored in WT and KO mice while the tongues were rinsed with 10 mM KCl (R) and then stimulated with 10 mM KCl + 60% ETH (R + 60% ETH), 100 mM NaCl (N), 100 mM NaCl + 5 μM Bz (N + Bz), 100 mM NaCl + 60% ETH (N + 60% ETH), and 100 mM NaCl + 5 μM Bz + 60% ETH (N + Bz + 60% ETH). The time period at which the rat tongue was superfused with different solutions is indicated by arrows.
F<sc>igure</sc> 9.
Figure 9.
CT responses in WT and VR-1 KO mice. Summary of data from three WT and three VR-1 KO mice. Each bar represents the mean ± SEM of the normalized CT response from three animals (N). R = 10 mM KCl; N = 100 mM NaCl + 10 mM KCl + 5 μM Bz; ETH = ethanol.
F<sc>igure</sc> 10.
Figure 10.
Proposed model for Na+ transport in fungiform TRCs and salt taste transduction in the anterior tongue. The abbreviations used in the figure are as follows: ENaC, amiloride-sensitive epithelial Na+ channel (green); VR-1, vanilloid receptor-1 (red); NHE-1, basolateral Na+-H+ exchanger-1; NHE-3, apical Na+-H+ exchanger-3; MAN, mannitol; Bz, benzamil; ETH, ethanol; CZP, capsazepine; RTX, resinifieratoxin; SB-366791, N-(3-methoxyphenyl)-4-chlorocinnamide; [Na]o, external Na+; CT, chorda tympani; t0.5, mean temperature at which the CT response was enhanced by 50%; paracellular shunt (dark blue); VGCC, voltage-gated Ca2+ channels (light blue); SOC, store-operated Ca2+ channel (purple); no change (↔); increase (↑); decrease (↓). See text for details.

Comment in

  • The salty and burning taste of capsaicin.
    Simon SA, de Araujo IE. Simon SA, et al. J Gen Physiol. 2005 Jun;125(6):531-4. doi: 10.1085/jgp.200509329. J Gen Physiol. 2005. PMID: 15928400 Free PMC article. No abstract available.

Similar articles

Cited by

References

    1. Caterina, M.J., A. Leffler, A.B. Malmberg, W.J. Martin, J. Trafton, K.R. Petersen-Zeitz, M. Koltzenburg, A.I. Basbaum, and D. Julius. 2000. Impaired nociception and pain sensation in mice lacking the capsaicin receptor. Science. 288:306–313. - PubMed
    1. Danilova, V., and G. Hellekant. 2000. The taste of ethanol in a primate model. II. Glossopharyngeal nerve response in Macaca mulatta. Alcohol. 21:259–269. - PubMed
    1. Davis, J.B., D. Smart, and M.J. Gunthorpe. 2002. The vanilloid receptors and vanilloid receptor-like genes: a hot topic getting hotter. Cell Transmissions. 18:3–9.
    1. Diamant, H., M. Funakoshi, L. Strom, and Y. Zotterman. 1963. Electrophysiological studies on human taste nerves. Olfaction and Taste I. Y. Zotterman, editor. Pergamon Press, Oxford. 193–203.
    1. DeSimone, J.A., V. Lyall, G.L. Heck, T.H.T. Phan, R.I. Alam, G.M. Feldman, and R.M. Buch. 2001. A novel pharmacological probe links the amiloride-insensitive NaCl, KCl, and NH4Cl chorda tympani taste responses. J. Neurophysiol. 86:2638–2641. - PubMed

Publication types

MeSH terms