. 2005 Jun;125(6):641-60.
doi: 10.1085/jgp.200509277.

The limit of photoreceptor sensitivity: molecular mechanisms of dark noise in retinal cones

Affiliations

The limit of photoreceptor sensitivity: molecular mechanisms of dark noise in retinal cones

David Holcman et al. J Gen Physiol. 2005 Jun.

Erratum in

  • J Gen Physiol. 2006 Feb;127(2):219-20

Abstract

Detection threshold in cone photoreceptors requires the simultaneous absorption of several photons because single photon photocurrent is small in amplitude and does not exceed intrinsic fluctuations in the outer segment dark current (dark noise). To understand the mechanisms that limit light sensitivity, we characterized the molecular origin of dark noise in intact, isolated bass single cones. Dark noise is caused by continuous fluctuations in the cytoplasmic concentrations of both cGMP and Ca(2+) that arise from the activity in darkness of both guanylate cyclase (GC), the enzyme that synthesizes cGMP, and phosphodiesterase (PDE), the enzyme that hydrolyzes it. In cones loaded with high concentration Ca(2+) buffering agents, we demonstrate that variation in cGMP levels arise from fluctuations in the mean PDE enzymatic activity. The rates of PDE activation and inactivation determine the quantitative characteristics of the dark noise power density spectrum. We developed a mathematical model based on the dynamics of PDE activity that accurately predicts this power spectrum. Analysis of the experimental data with the theoretical model allows us to determine the rates of PDE activation and deactivation in the intact photoreceptor. In fish cones, the mean lifetime of active PDE at room temperature is approximately 55 ms. In nonmammalian rods, in contrast, active PDE lifetime is approximately 555 ms. This remarkable difference helps explain why cones are noisier than rods and why cone photocurrents are smaller in peak amplitude and faster in time course than those in rods. Both these features make cones less light sensitive than rods.


Figures

F<sc>igure</sc> 1.
Figure 1.
Dark noise and photocurrents in bass single cone at room temperature. Membrane current measured under voltage clamp at −40 mV holding voltage. (A) Membrane current in the dark (top trace) and under continuous illumination (1.2 × 10⁵ 540 nm photons/μm2 s) (bandpass 0–40 Hz). The mean holding current in dark was 9.7 pA and noise variance 0.21 pA2. The mean holding current in light was 28.9 pA and noise variance 0.02 pA2. (B) Photocurrent activated by 10-ms flash of 540-nm light presented at time zero. Responses generated by flashes that delivered 2.3, 10.8, 62, 246, 1,486, and 6,795 photons/μm2. The light dependence of the photocurrent peak amplitude reached half maximum amplitude at σ = 220 photons/μm2 (Eq. 1.1). (C) Power spectra of the fluctuations in current amplitude in darkness (open symbols) and under continuous illumination (filled symbols) shown in A. The continuous line over the data is a best fit theoretical function detailed in the text (Eq. 1.13). The dashed line over the data in light is a straight line optimally fit to the data points. (D) Power spectrum of the photocurrent generated by the 62 photon/μm2 photon flash shown in B. The continuous line over the data is an optimally fit product of four identical Lorentzians (Eq. 1.2) with α = 5.04 Hz. The dotted line is the function that describes dark noise spectrum (from C) shifted to match the zero frequency asymptote. It is drawn to illustrate the difference between photocurrent and dark current noise spectra.
F<sc>igure</sc> 2.
Figure 2.
Dark noise and photocurrents in bass single cone loaded with 10 mM BAPTA at 400 nM free Ca2+ to attenuate fluctuation in free Ca2+. Voltage-clamped membrane current measured at −40 mV holding voltage. (A) Membrane current in the dark (top trace) and under continuous illumination (1.2 × 10⁵ 540 nm photons/μm2 s) (bandpass 0–40 Hz). Mean holding current in dark was −38.7 pA and noise variance 0.261 pA2. Mean holding current in light was 1 pA and noise variance 0.031 pA2. (B) Photocurrent activated by 10-ms flash of 540-nm light presented at time zero. Responses generated by flashes that delivered 0.6, 2.5, 11.2, 64.5, 257, and 1,546 photons/μm2. The light dependence of the photocurrent peak amplitude reached half maximum amplitude at σ = 28.4 photons/μm2 (Eq. 1.1). (C) Power spectra of the fluctuations in current amplitude (noise) in darkness (open symbols) and under continuous illumination (filled symbols) shown in A. The continuous line over the data is a theoretical function based on a model of the molecular origin of the current fluctuations (Eq. 1.8). The dashed line over the data in light is a straight line optimally fit to the data points. (D) Power spectra of the photocurrent generated by a 11.2 photon/μm2 photon flash shown in B. The continuous line over the data is an optimally fit product of three identical Lorentzians with α = 1.69 Hz. The dotted line is the function that describes dark noise spectrum (from C) shifted to match the zero frequency asymptote. It is drawn to illustrate the difference between photocurrent and dark current noise spectra.
F<sc>igure</sc> 3.
Figure 3.
Dark noise and photocurrents in a bass single loaded with 10 mM BAPTA at 400 nM free Ca2+ and briefly treated with hydroxylamine to decrease the number of dark VP molecules. (A) Comparison of the power spectra of the dark noise (continuous line) and the dim light photocurrent (dotted line) in the same cell. The lines are redrawn from C and D but scaled to match their zero frequency amplitude. The panel graphically demonstrates the difference between the two power spectra. (B) Photocurrent activated by 10-ms flash of 540-nm light presented at time zero. Responses generated by flashes that delivered 233, 6,417, and 25,546 photons/μm2. At the brightest light tested, the peak amplitude was only ∼15% of that measured in untreated cells. The loss in light sensitivity demonstrates that the treated cell lost >1/103 VP molecules in the dark. (C) Power spectra of dark current fluctuations in the same hydroxylamine-treated cone. The continuous line over the data is an optimally fit theoretical function based on a model of the molecular origin of current fluctuations (Eq. 1.8). (D) Power spectra of the photocurrent generated by the 25,546 photon/μm2 photon flash shown in B. The continuous line over the data is an optimally fit product of three identical Lorentzians with α = 1.75 Hz. For comparison, open circles illustrate the function that best describes the mean dim light photocurrent in untreated cones (α = 2.17 Hz). The near identity of the two spectra shows that transient hydroxylamine treatment does not affect the photoresponse of bass cones, although they are much less sensitive to light.
F<sc>igure</sc> 4.
Figure 4.
Dark noise in bass single cones loaded with 10 mM BAPTA at 400 nM free Ca2+ and different cyclic guanosine nucleotides. Voltage-clamped membrane current measured at −40 mV holding voltage. (A) Cone loaded with a solution lacking cGMP, GTP, and ATP. Only voltage-gated ion channels are active in this cell. The mean holding current in dark was 68.5 pA. Light did not change the current. The power spectrum of the current fluctuations is shown in the bottom panel. It is well described by the dashed, straight line. (B) Cone loaded with a solution containing 2 μM 8-cpt-cGMP and lacking GTP or ATP. cGMP-gated ion channels are active in this cell, but the cyclic nucleotide is not hydrolyzed by PDE. The mean holding current in dark was −82 pA, but it is essentially noiseless in the 0–30 Hz range. The cell does not respond to light. The power spectrum of the current fluctuations is shown in the bottom panel. It is well described by a straight line, not different from the spectrum in the complete absence of nucleotides. (C) Cone loaded with the normal 1 mM GTP and 3 mM ATP. Holding current in dark was −54 pA. The bottom panel illustrates the power spectrum of the dark noise. It is well described by Eq. 1.8, the continuous line optimally fit to experimental data. Dark noise in BAPTA-loaded cones is detected only in the presence of cGMP and originates from fluctuations in PDE activity.
F<sc>igure</sc> 5.
Figure 5.
The effect of zaprinast superfusion on the holding current of a normal bass single cone in the dark. Voltage-clamped membrane currents measured in the same cell at −40 mV holding voltage. The mean holding current in dark was 8.2 and the noise variance 0.274 pA2. (A) Photocurrent activated by 10-ms flash of 540-nm light presented at time zero. Responses generated by flashes that delivered 2.4, 10.8, 62, 242, and 1,486 photons/μm2. The light dependence of the photocurrent peak amplitude reached half maximum amplitude at σ = 146 photons/μm2 (Eq. 1.1). (B) Power spectra of the dark noise. The continuous line over the data in darkness is a function derived from a theoretical model of the molecular origin of the current fluctuations (Eq. 1.13). (C) At time = 0, the solution bathing the cone was rapidly (<50 ms) switched to one containing 200 μM zaprinast, a membrane-permeable blocker of PDE activity. The inward holding current increased linearly at first and then reached a new stationary value. The slope of the linear current change near t = 0 was −16.6 pA/s. From this slope, we computed the rate of cGMP synthesis in the dark, γdark = 4.89 μM/s (Appendix 3).
F<sc>igure</sc> 6.
Figure 6.
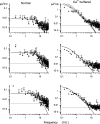
Dark noise power spectra measured in different bass cones. Experimental data are in symbols and the continuous line is optimally fit theoretical function based on a model of the molecular origin of the dark noise. On the left are data measured in normal cells. On the right are data measured in cones loaded with 10 mM BAPTA at 400 nM free Ca2+. The top panel on the right illustrates both the optimally fit theoretical function and confidence limits if the value of the single adjustable parameter, w 1, were 20% larger or smaller than optimized by the fitting algorithm.
F<sc>igure</sc> 7.
Figure 7.
Simulations of the expected time course of photoexcited VP and PDE in nonmammalian rods and cones at room temperature. The left panels illustrate the response to a single excited VP molecule and those on the right the response to 10 molecules. Simulations are based on the lifetime of active PDE in rods and cones derived from dark noise analysis by Rieke and Baylor (1996) or this report (Table II). The lifetime of PDE is 10 times shorter in cones than in rods (54 ms and 555 ms, respectively). As a consequence, it can be expected that when the same number of visual pigment molecules are excited in the photoreceptors, the total number of activated PDE molecules will be less in cones than rods, and this number will be reached more rapidly in cones than in rods.

Similar articles

Cited by

References

    1. Barnes, S., and B. Hille. 1989. Ionic channels of the inner segment of tiger salamander cone photoreceptors. J. Gen. Physiol. 94:719–743. - PMC - PubMed
    1. Baylor, D.A., T.D. Lamb, and K.W. Yau. 1979. Responses of retinal rods to single photons. J. Physiol. 288:613–634. - PMC - PubMed
    1. Baylor, D.A., G. Matthews, and K.W. Yau. 1980. Two components of electrical dark noise in toad retinal rod outer segments. J. Physiol. 309:591–621. - PMC - PubMed
    1. Baylor, D.A., B.J. Nunn, and J.L. Schnapf. 1984. The photocurrent, noise and spectral sensitivity of rods of the monkey macaca fascicularis. J. Physiol. 357:575–607. - PMC - PubMed
    1. Beavo, J.A. 1995. Cyclic nucleotide phosphodiesterases: functional implications of multiple isoforms. Physiol. Rev. 75:725–748. - PubMed

Publication types

MeSH terms