. 2005 Nov;26(3):191-8.
doi: 10.1002/hbm.20156.

Genetic components of functional connectivity in the brain: the heritability of synchronization likelihood

Affiliations

Genetic components of functional connectivity in the brain: the heritability of synchronization likelihood

Danielle Posthuma et al. Hum Brain Mapp. 2005 Nov.

Abstract

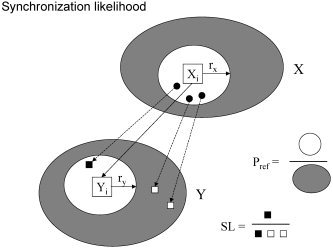
Cognitive functions require the integrated activity of multiple specialized, distributed brain areas. Such functional coupling depends on the existence of anatomical connections between the various brain areas as well as physiological processes whereby the activity in one area influences the activity in another area. Recently, the Synchronization Likelihood (SL) method was developed as a general method to study both linear and nonlinear aspects of coupling. In the present study the genetic architecture of the SL in different frequency bands was investigated. Using a large genetically informative sample of 569 subjects from 282 extended twin families we found that the SL is moderately to highly heritable (41-67%) especially in the alpha frequency (8-13 Hz) range. This index of functional connectivity of the brain has been associated with a number of pathological states of the brain. The significant heritability found here suggests that SL can be used to examine the genetic susceptibility to these conditions.


Figures

Figure 1
Figure 1
Schematic explanation of the synchronization likelihood. The gray areas X and Y represent the attractors of system X and Y. These attractors consist of a number of vectors Xi and Yi which represent all possible states of system X and Y. The vectors are reconstructed from the time series by the procedure of time delay embedding. The synchronization likelihood (SL) between X and Y at time i is determined by considering all vectors in X that are closer to Xi than a critical distance rx. These close neighbors of Xi are indicated by the white area around Xi. Each of these close neighbors of Xi (the three black dots in the white area) has a corresponding point (that is: a vector with the same time index) in Y: these are indicated by the black and white squares in Y. Some of these corresponding vectors in Y will be close to Yi (the black square within the white area around Yi, determined by ry), others (the white squares, in the gray area) not. The SL is now defined as the likelihood that the corresponding vectors (the squares) will be close to Yi (fall in the whiter area around Yi). This likelihood is 1 in the case of perfect synchronization, and small in the case of no coupling. The value of the SL in the case of no coupling can be controlled by the use of Pref, considering that in the case of no coupling the distribution of the squares over Y will be random. This is done by choosing the critical distances rx and ry such that the likelihood that a randomly chosen point in X will be closer to X than rx equals Pref; similarly, the likelihood that a random vector in Y will be closer to Yi than ry equals Pref. Pref is the same for X and Y, but rx and ry usually are not the same.
Figure 2
Figure 2
Decomposition of the observed variance in SL across 17 different electrode positions (horizontal axis) for the five frequency bands delta, theta, alpha 1, alpha 2, and beta. The variance is decomposed into three sources: additive genetic influences (A, heritability), common environmental influences (C), and nonshared environmental influences (E). The vertical axis represents the percent of the total variance that is explained by each of the three sources. All values of A, C, and E are based on estimates from the model in which all three sources of variation were included. The dotted line indicates the contribution of additive genetic factors to SL variance that, on average, could be detected with a significance level of 0.01.

References

    1. Altenburg J, Vermeulen RJ, Strijers RLM, Fetter WPF, Stam CJ (2003): Seizure detection in the neonatal EEG with synchronization likelihood. Clin Neurophysiol 114: 50–55. - PubMed
    1. Babiloni C, Ferri F, Moretti DV, Strambi A, Binetti G, Dal Forno G, Ferreri F, Lanuzza B, Bonato C, Nobili F, Rodriguez G, Salinari S, Passero S, Rocchi R, Stam CJ, Rossini PM (2004): Abnormal fronto‐parieto coupling of brain rhythms in mild Alzheimer's disease: a multicentric EEG study. Eur J Neurosci 19: 1–9. - PubMed
    1. Boomsma DI (1998): Twin registers in Europe: an overview. Twin Res 1: 34–51. - PubMed
    1. Boomsma D, Busjahn A, Peltonen L (2002): Classical twin studies and beyond. Nat Rev Genet 3: 872–882. - PubMed
    1. Breakspear M, Williams LM, Stam CJ (2004): A novel method for the topographic analysis of neural activity reveals formation and dissolution of ‘dynamic cell assemblies.’ J Computat Neurosci 16: 49–68. - PubMed

Publication types