

Pretransition and progressive softening of bovine carbonic anhydrase II as probed by single molecule atomic force microscopy
- PMID: 15929995
- PMCID: PMC2253376
- DOI: 10.1110/ps.041282305
Pretransition and progressive softening of bovine carbonic anhydrase II as probed by single molecule atomic force microscopy
Abstract
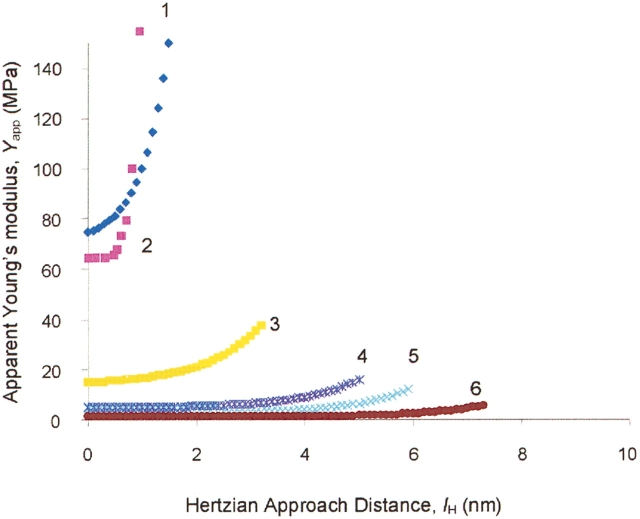
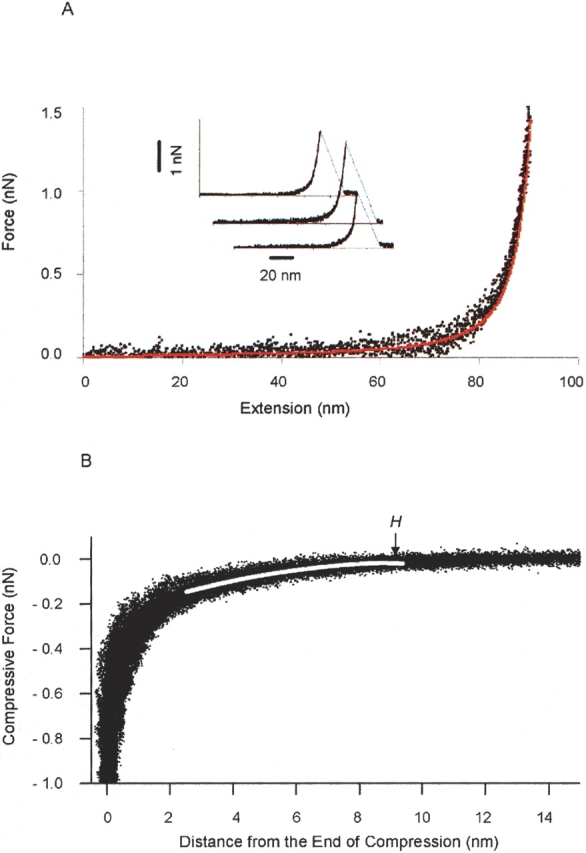
To develop a simple method for probing the physical state of surface adsorbed proteins, we adopted the force curve mode of an atomic force microscope (AFM) to extract information on the mechanical properties of surface immobilized bovine carbonic anhydrase II under native conditions and in the course of guanidinium chloride-induced denaturation. A progressive increase in the population of individually softened molecules was probed under mildly to fully denaturing conditions. The use of the approach regime of force curves gave information regarding the height and rigidity of the molecule under compressive stress, whereas use of the retracting regime of the curves gave information about the tensile characteristics of the protein. The results showed that protein molecules at the beginning of the transition region possessed slightly more flattened and significantly more softened conformations compared with that of native molecules, but were still not fully denatured, in agreement with results based on solution studies. Thus the force curve mode of an AFM was shown to be sensitive enough to provide information concerning the different physical states of single molecules of globular proteins.
Figures


Similar articles
-
Nanobiomechanics of proteins and biomembrane.Philos Trans R Soc Lond B Biol Sci. 2008 Jun 27;363(1500):2163-71. doi: 10.1098/rstb.2008.2269. Philos Trans R Soc Lond B Biol Sci. 2008. PMID: 18339603 Free PMC article.
-
Dynamics of a partially stretched protein molecule studied using an atomic force microscope.Biophys Chem. 2004 Jan 1;107(1):51-61. doi: 10.1016/j.bpc.2003.08.006. Biophys Chem. 2004. PMID: 14871600
-
Local rigidity of a protein molecule.Biophys Chem. 2005 Aug 1;116(3):187-91. doi: 10.1016/j.bpc.2005.04.003. Biophys Chem. 2005. PMID: 15882923
-
Electrostatic orientation of enzymes on surfaces for ligand screening probed by force spectroscopy.Langmuir. 2006 Jan 31;22(3):887-92. doi: 10.1021/la0525731. Langmuir. 2006. PMID: 16430243
-
Atomic force bio-analytics.Curr Opin Chem Biol. 2003 Oct;7(5):641-7. doi: 10.1016/j.cbpa.2003.08.010. Curr Opin Chem Biol. 2003. PMID: 14580570 Review.
Cited by
-
Mechanical characterization of cervical squamous carcinoma cells by atomic force microscopy at nanoscale.Med Oncol. 2015 Mar;32(3):71. doi: 10.1007/s12032-015-0507-0. Epub 2015 Feb 19. Med Oncol. 2015. PMID: 25694045
-
Job Opening for Nucleosome Mechanic: Flexibility Required.Cells. 2020 Mar 1;9(3):580. doi: 10.3390/cells9030580. Cells. 2020. PMID: 32121488 Free PMC article. Review.
-
Nanobiomechanics of proteins and biomembrane.Philos Trans R Soc Lond B Biol Sci. 2008 Jun 27;363(1500):2163-71. doi: 10.1098/rstb.2008.2269. Philos Trans R Soc Lond B Biol Sci. 2008. PMID: 18339603 Free PMC article.
-
Interaction between pheromone and its receptor of the fission yeast Schizosaccharomyces pombe examined by a force spectroscopy study.J Biomed Biotechnol. 2012;2012:804793. doi: 10.1155/2012/804793. Epub 2012 Feb 21. J Biomed Biotechnol. 2012. PMID: 22500108 Free PMC article.
-
Tensile mechanics of alanine-based helical polypeptide: force spectroscopy versus computer simulations.Biophys J. 2009 Feb;96(3):1105-14. doi: 10.1016/j.bpj.2008.10.046. Biophys J. 2009. PMID: 19186146 Free PMC article.
References
-
- Afrin, R., Arakawa, H., Osada, T., and Ikai, A. 2003. Extraction of membrane proteins from a living cell surface using the atomic force microscope and covalent crosslinkers. Cell Biochem. Biophys. 39 101–117. - PubMed
-
- Akasaka, K. 2003. Highly fluctuating protein structures revealed by variable-pressure nuclear magnetic resonance. Biochemistry 42 10875–10885. - PubMed
-
- Akhremitchev, B.B. and Walker, G.C. 1999. Finite sample thickness effects on elasticity determination using atomic force microscopy. Langmuir 15 5630–5634.
-
- Alam, M.T, Yamada, T., Carlsson, U., and Ikai, A. 2002. The importance of being knotted: Effects of the C-terminal knot structure on enzymatic and mechanical properties of bovine carbonic anhydrase II. FEBS Lett. 519 35–40. - PubMed
-
- Almstedt, K., Lundqvist, M., Carlsson, J., Karlsson, M., Persson, B., Jonsson, B.H., Carlsson, U., and Hammarstrom, P. 2004. Unfolding a folding disease: Folding, misfolding and aggregation of the marble brain syndrome-associated mutant H107Y of human carbonic anhydrase II. J. Mol. Biol. 342 619–633. - PubMed
Publication types
MeSH terms
Substances
LinkOut - more resources
Full Text Sources
Miscellaneous
