

N-terminal acetylation and protonation of individual hemoglobin subunits: position-dependent effects on tetramer strength and cooperativity
- PMID: 15929996
- PMCID: PMC2253374
- DOI: 10.1110/ps.041267405
N-terminal acetylation and protonation of individual hemoglobin subunits: position-dependent effects on tetramer strength and cooperativity
Abstract
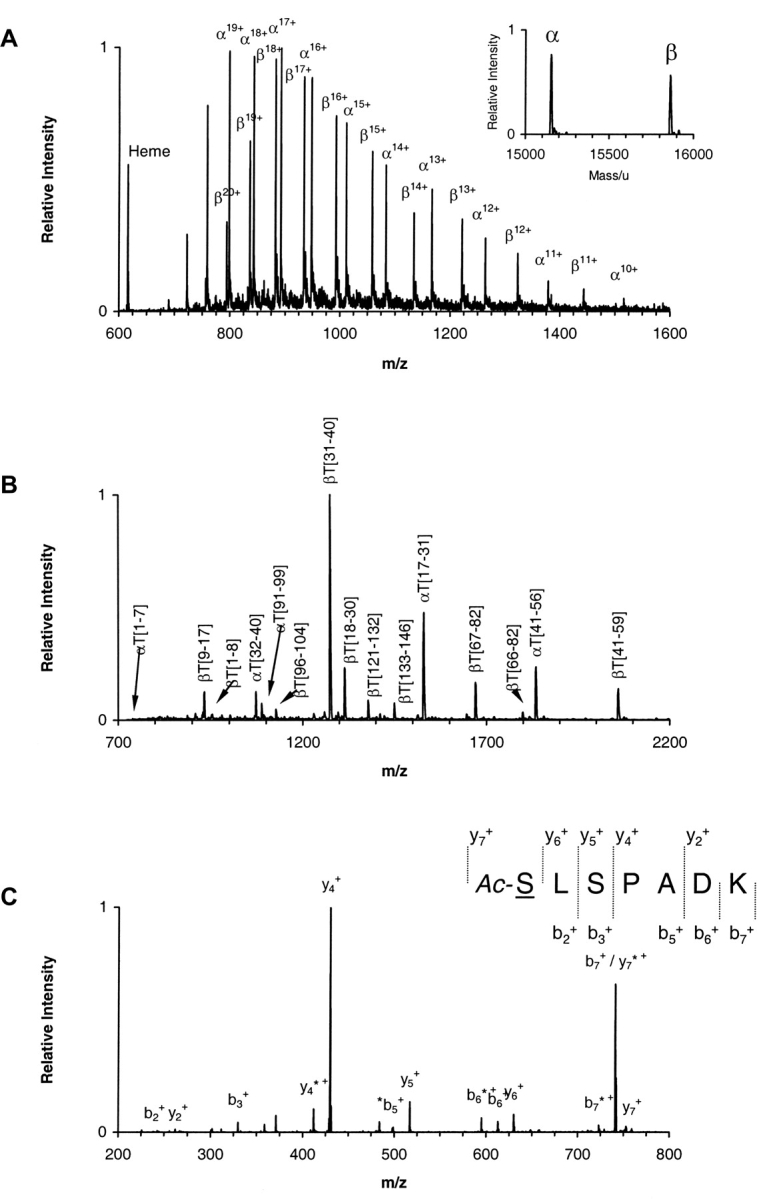
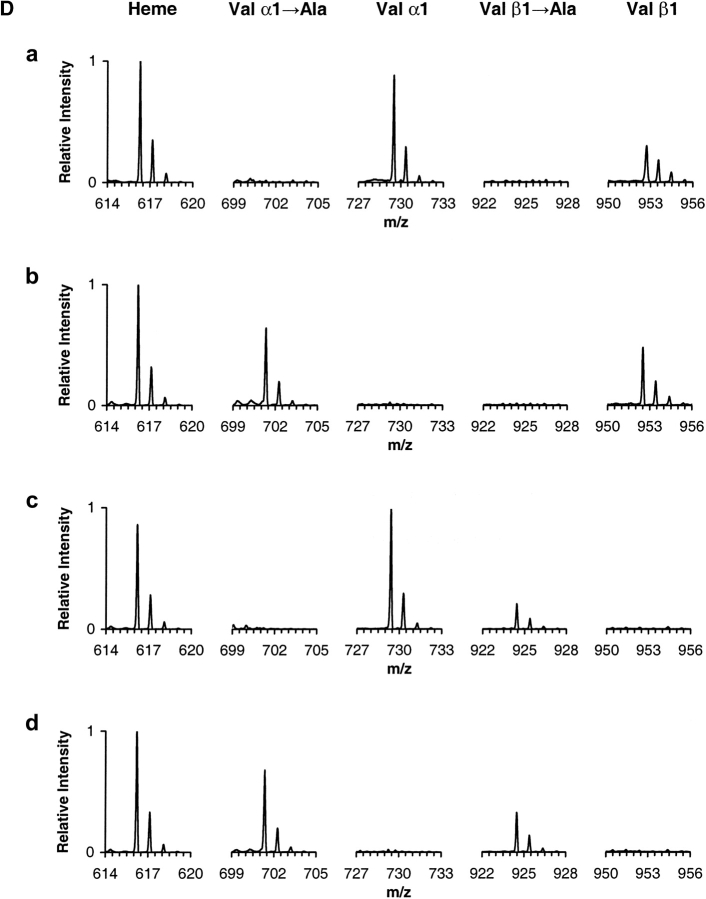
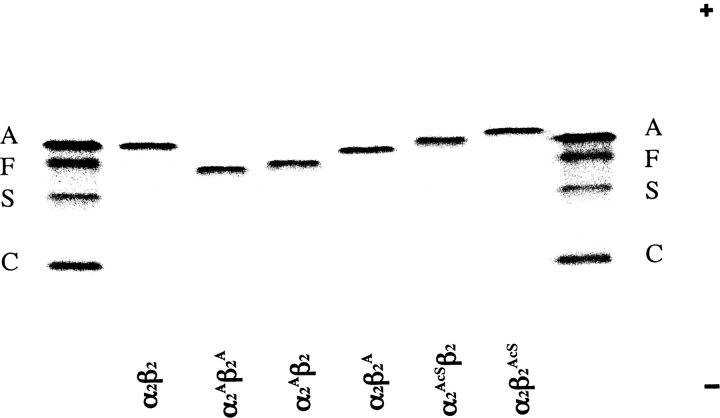
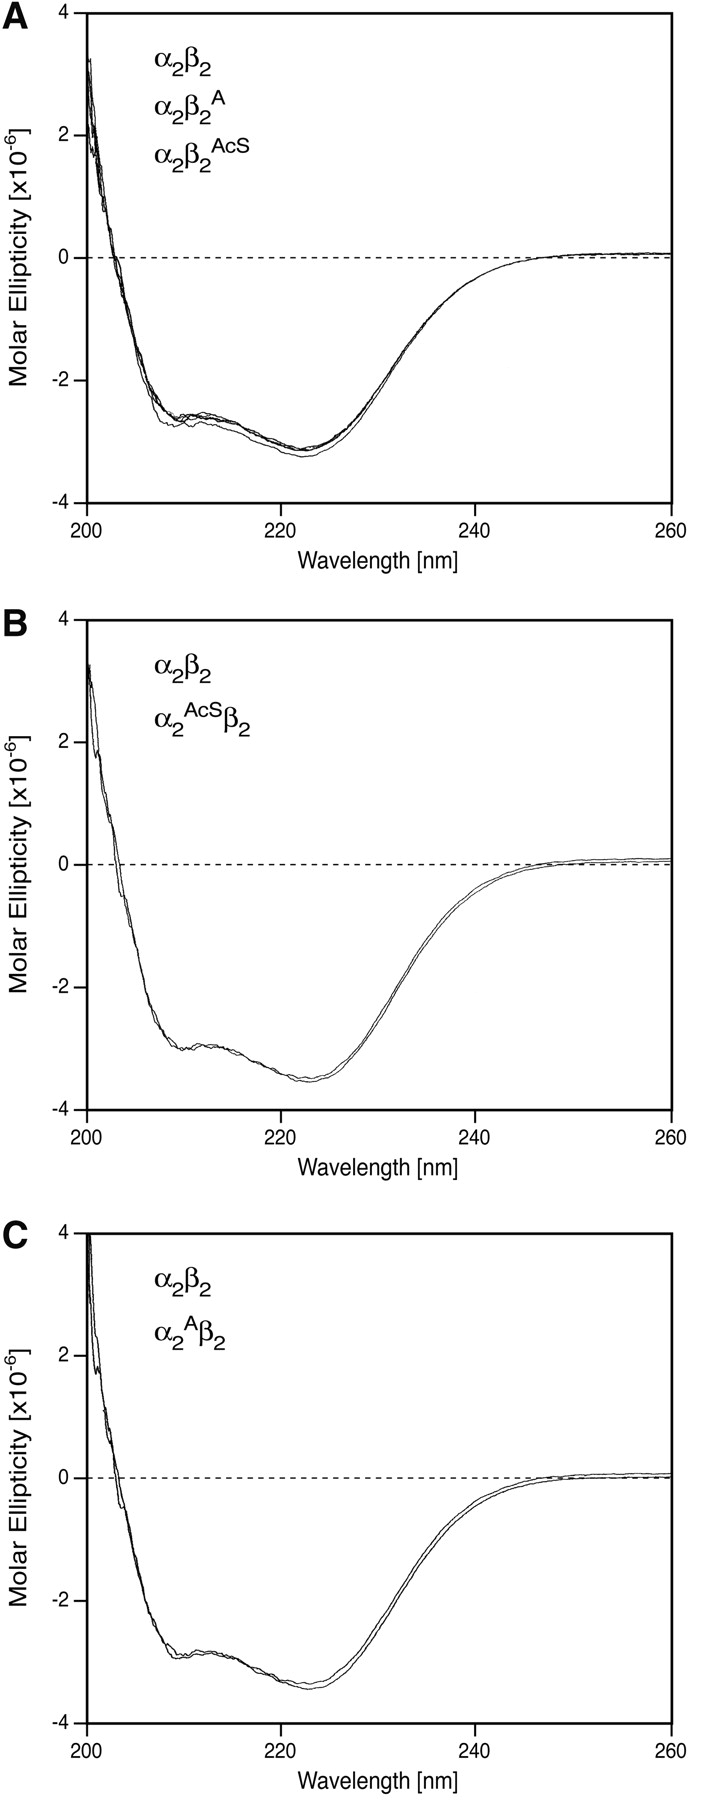
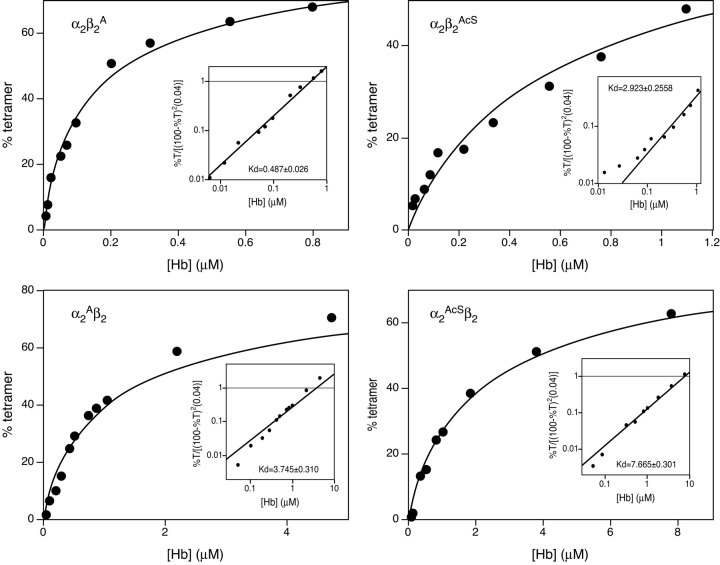
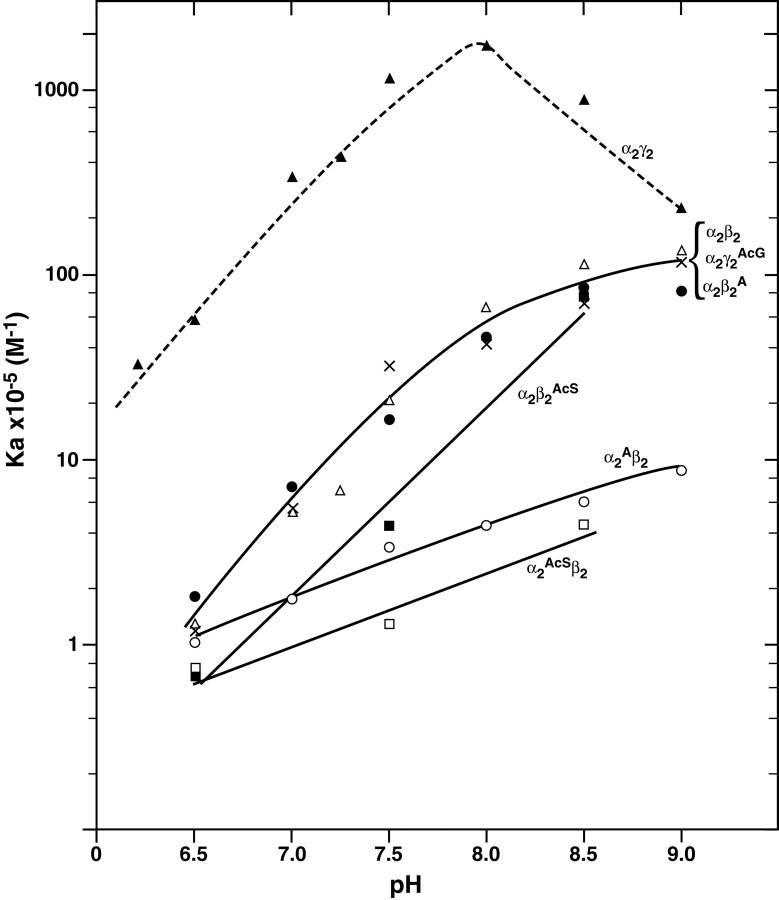
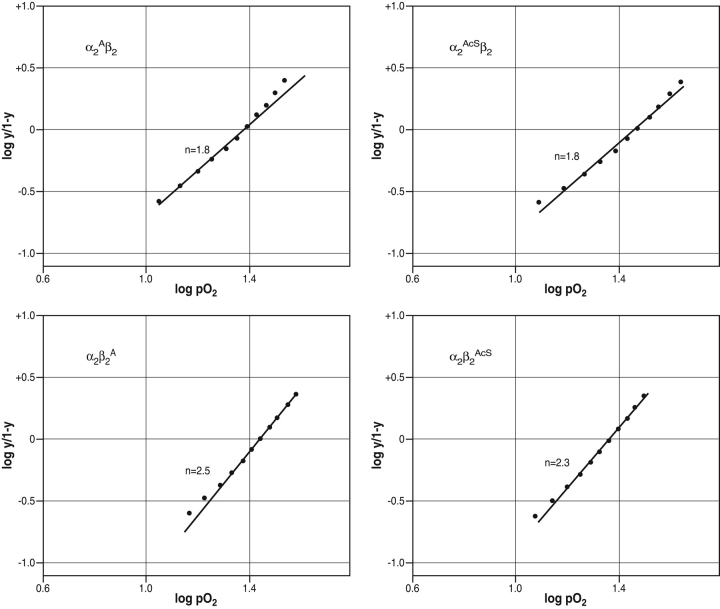
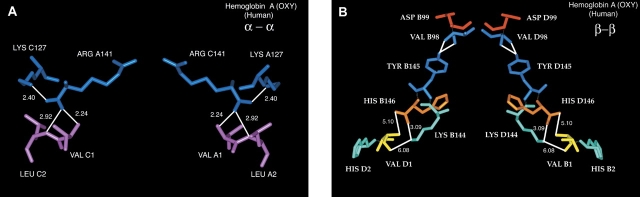
The presence of alanine (Ala) or acetyl serine (AcSer) instead of the normal Val residues at the N-terminals of either the alpha- or the beta-subunits of human adult hemoglobin confers some novel and unexpected features on the protein. Mass spectrometric analysis confirmed that these substitutions were correct and that they were the only ones. Circular dichroism studies indicated no global protein conformational changes, and isoelectric focusing showed the absence of impurities. The presence of Ala at the N-terminals of the alpha-subunits of liganded hemoglobin results in a significantly increased basicity (increased pK(a) values) and a reduction in the strength of subunit interactions at the allosteric tetramer-dimer interface. Cooperativity in O(2) binding is also decreased. Substitution of Ala at the N-terminals of the beta-subunits gives neither of these effects. The substitution of Ser at the N terminus of either subunit leads to its complete acetylation (during expression) and a large decrease in the strength of the tetramer-dimer allosteric interface. When either Ala or AcSer is present at the N terminus of the alpha-subunit, the slope of the plot of the tetramer-dimer association/dissociation constant as a function of pH is decreased by 60%. It is suggested that since the network of interactions involving the N and C termini of the alpha-subunits is less extensive than that of the beta-subunits in liganded human hemoglobin disruptions there are likely to have a profound effect on hemoglobin function such as the increased basicity, the effects on tetramer strength, and on cooperativity.
Figures
Similar articles
-
N-terminal contributions of the gamma-subunit of fetal hemoglobin to its tetramer strength: remote effects at subunit contacts.Protein Sci. 2002 Jan;11(1):27-35. doi: 10.1110/ps.30602. Protein Sci. 2002. PMID: 11742119 Free PMC article.
-
The acetylation state of human fetal hemoglobin modulates the strength of its subunit interactions: long-range effects and implications for histone interactions in the nucleosome.Biochemistry. 2001 Feb 13;40(6):1635-9. doi: 10.1021/bi002157+. Biochemistry. 2001. PMID: 11327822
-
Hemoglobin site-mutants reveal dynamical role of interhelical H-bonds in the allosteric pathway: time-resolved UV resonance Raman evidence for intra-dimer coupling.J Mol Biol. 2004 Jul 16;340(4):857-68. doi: 10.1016/j.jmb.2004.05.013. J Mol Biol. 2004. PMID: 15223326
-
Effects of substitutions of lysine and aspartic acid for asparagine at beta 108 and of tryptophan for valine at alpha 96 on the structural and functional properties of human normal adult hemoglobin: roles of alpha 1 beta 1 and alpha 1 beta 2 subunit interfaces in the cooperative oxygenation process.Biochemistry. 1999 Jul 6;38(27):8751-61. doi: 10.1021/bi990286o. Biochemistry. 1999. PMID: 10393550
-
Mutagenic dissection of hemoglobin cooperativity: effects of amino acid alteration on subunit assembly of oxy and deoxy tetramers.Proteins. 1992 Nov;14(3):333-50. doi: 10.1002/prot.340140303. Proteins. 1992. PMID: 1438173 Review.
Cited by
-
Contributions to nucleosome dynamics in chromatin from interactive propagation of phosphorylation/acetylation and inducible histone lysine basicities.Protein Sci. 2018 Mar;27(3):662-671. doi: 10.1002/pro.3359. Epub 2018 Jan 5. Protein Sci. 2018. PMID: 29226473 Free PMC article.
-
Composition and biological significance of the human Nalpha-terminal acetyltransferases.BMC Proc. 2009 Aug 4;3 Suppl 6(Suppl 6):S3. doi: 10.1186/1753-6561-3-S6-S3. BMC Proc. 2009. PMID: 19660096 Free PMC article.
-
Effect of NH2-terminal acetylation on the oxygenation properties of vertebrate haemoglobin.Biochem J. 2020 Oct 16;477(19):3839-3850. doi: 10.1042/BCJ20200623. Biochem J. 2020. PMID: 32936244 Free PMC article.
-
The biological functions of Naa10 - From amino-terminal acetylation to human disease.Gene. 2015 Aug 10;567(2):103-31. doi: 10.1016/j.gene.2015.04.085. Epub 2015 May 16. Gene. 2015. PMID: 25987439 Free PMC article. Review.
-
Energetic differences at the subunit interfaces of normal human hemoglobins correlate with their developmental profile.Biochemistry. 2009 Aug 18;48(32):7568-74. doi: 10.1021/bi900857r. Biochemistry. 2009. PMID: 19583196 Free PMC article.
References
-
- Atha, D.H. and Riggs, A. 1976. Tetramer–dimer dissociation in hemoglobin and the Bohr effect. J. Biol. Chem. 251 5537–5543. - PubMed
-
- Beavis, R.C. and Chait, B.T. 1996. Matrix-assisted laser desorption ionization mass-spectrometry of proteins. Methods Enzymol. 270 519–551. - PubMed
-
- Bradshaw, R.A., Brickey, W.W., and Walker, K.W. 1998. N-terminal processing: The methionine aminopeptidase and N-acetyl transferase families. Trends Biochem. Sci. 23 263–267. - PubMed
Publication types
MeSH terms
Substances
Grants and funding
LinkOut - more resources
Full Text Sources
