A critical assessment of the topomer search model of protein folding using a continuum explicit-chain model with extensive conformational sampling
- PMID: 15930009
- PMCID: PMC2253387
- DOI: 10.1110/ps.041317705
A critical assessment of the topomer search model of protein folding using a continuum explicit-chain model with extensive conformational sampling
Abstract
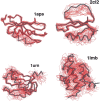
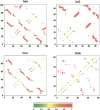
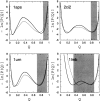
Recently, a series of closely related theoretical constructs termed the "topomer search model" (TSM) has been proposed for the folding mechanism of small, single-domain proteins. A basic assumption of the proposed scenarios is that the rate-limiting step in folding is an essentially unbiased, diffusive search for a conformational state called the native topomer defined by an overall native-like topological pattern. Successes in correlating TSM-predicted folding rates with that of real proteins have been interpreted as experimental support for the model. To better delineate the physics entailed, key TSM concepts are examined here using extensive Langevin dynamics simulations of continuum C(alpha) chain models. The theoretical native topomers of four experimentally well-studied two-state proteins are characterized. Consistent with the TSM perspective, we found that the sizes of the native topomers increase with experimental folding rate. However, a careful determination of the corresponding probabilities that the native topomers are populated during a random search fails to reproduce the previously predicted folding rates. Instead, our results indicate that an unbiased TSM search for the native topomer amounts to a Levinthal-like process that would take an impossibly long average time to complete. Furthermore, intraprotein contacts in all four native topomers considered exhibit no apparent correlation with the experimental phi-values determined from the folding kinetics of these proteins. Thus, the present findings suggest that certain basic, generic yet essential energetic features in protein folding are not accounted for by TSM scenarios to date.
Figures


Similar articles
-
The topomer-sampling model of protein folding.Proc Natl Acad Sci U S A. 1999 Mar 16;96(6):2596-601. doi: 10.1073/pnas.96.6.2596. Proc Natl Acad Sci U S A. 1999. PMID: 10077555 Free PMC article.
-
The topomer search model: A simple, quantitative theory of two-state protein folding kinetics.Protein Sci. 2003 Jan;12(1):17-26. doi: 10.1110/ps.0220003. Protein Sci. 2003. PMID: 12493824 Free PMC article. Review.
-
Solvation effects and driving forces for protein thermodynamic and kinetic cooperativity: how adequate is native-centric topological modeling?J Mol Biol. 2003 Feb 21;326(3):911-31. doi: 10.1016/s0022-2836(02)01434-1. J Mol Biol. 2003. PMID: 12581650
-
Simple two-state protein folding kinetics requires near-levinthal thermodynamic cooperativity.Proteins. 2003 Sep 1;52(4):510-23. doi: 10.1002/prot.10506. Proteins. 2003. PMID: 12910451
-
First principles prediction of protein folding rates.J Mol Biol. 1999 Dec 3;294(3):619-25. doi: 10.1006/jmbi.1999.3278. J Mol Biol. 1999. PMID: 10610784 Review.
Cited by
-
Why do protein folding rates correlate with metrics of native topology?PLoS One. 2012;7(4):e35599. doi: 10.1371/journal.pone.0035599. Epub 2012 Apr 27. PLoS One. 2012. PMID: 22558173 Free PMC article.
-
Effects of Topology and Sequence in Protein Folding Linked via Conformational Fluctuations.Biophys J. 2020 Mar 24;118(6):1370-1380. doi: 10.1016/j.bpj.2020.01.020. Epub 2020 Jan 28. Biophys J. 2020. PMID: 32061276 Free PMC article.
-
Rerouting the folding pathway of the Notch ankyrin domain by reshaping the energy landscape.J Am Chem Soc. 2008 Apr 30;130(17):5681-8. doi: 10.1021/ja0763201. Epub 2008 Apr 9. J Am Chem Soc. 2008. PMID: 18396879 Free PMC article.
-
What have we learned from the studies of two-state folders, and what are the unanswered questions about two-state protein folding?Phys Biol. 2009 Feb 10;6(1):015001. doi: 10.1088/1478-3975/6/1/015001. Phys Biol. 2009. PMID: 19208936 Free PMC article.
-
Protein folding thermodynamics and dynamics: where physics, chemistry, and biology meet.Chem Rev. 2006 May;106(5):1559-88. doi: 10.1021/cr040425u. Chem Rev. 2006. PMID: 16683745 Free PMC article. Review. No abstract available.
References
Publication types
MeSH terms
Substances
LinkOut - more resources
Full Text Sources

