. 2005 Oct;289(4):C1052-68.
doi: 10.1152/ajpcell.00546.2004. Epub 2005 Jun 1.

Dominant-negative PKC-epsilon impairs apical actin remodeling in parallel with inhibition of carbachol-stimulated secretion in rabbit lacrimal acini

Affiliations

Dominant-negative PKC-epsilon impairs apical actin remodeling in parallel with inhibition of carbachol-stimulated secretion in rabbit lacrimal acini

Galina V Jerdeva et al. Am J Physiol Cell Physiol. 2005 Oct.

Abstract

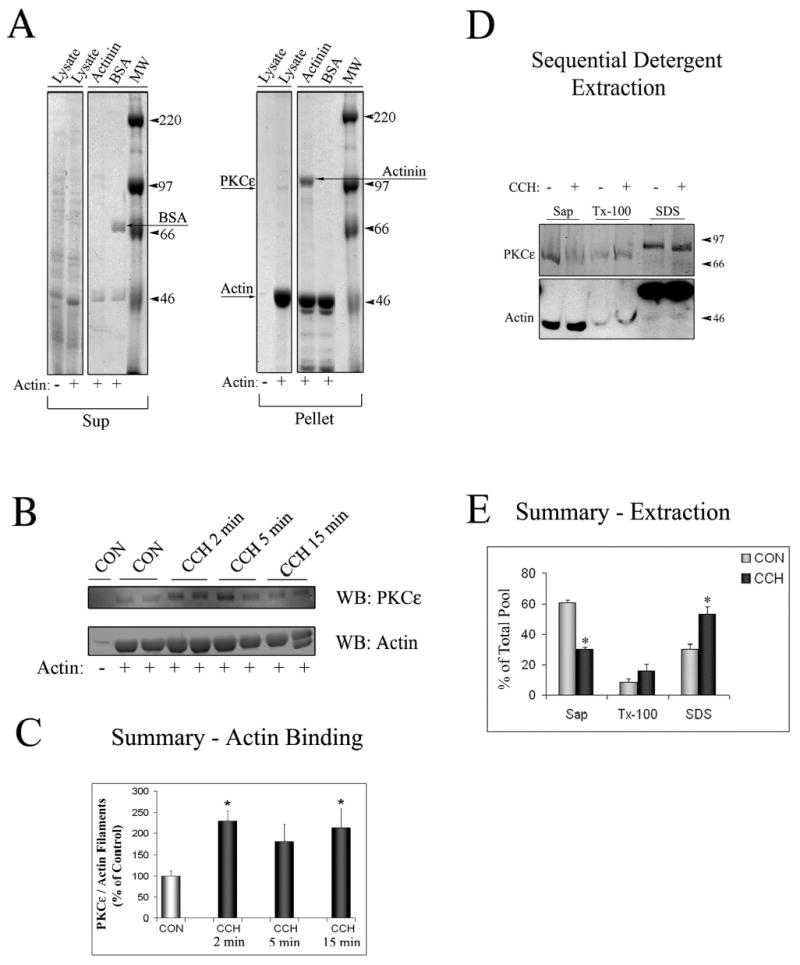
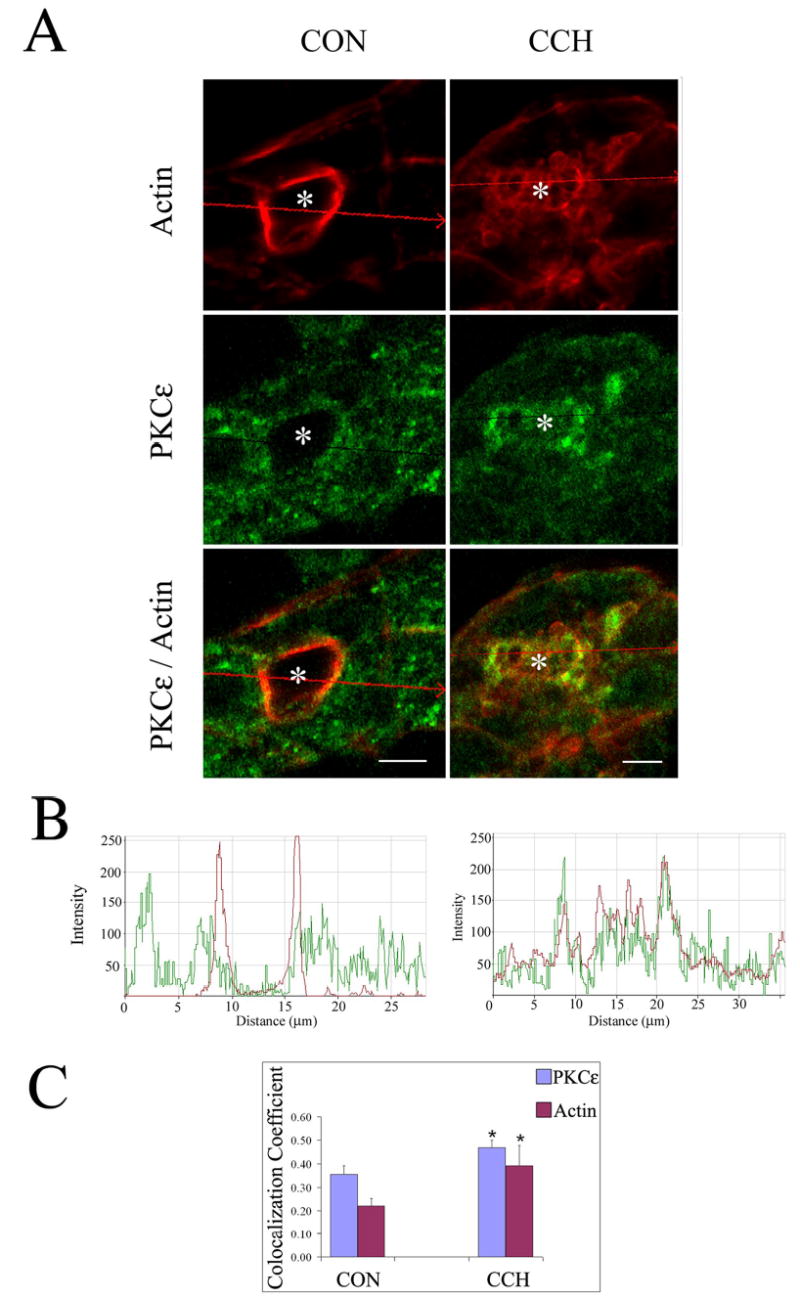
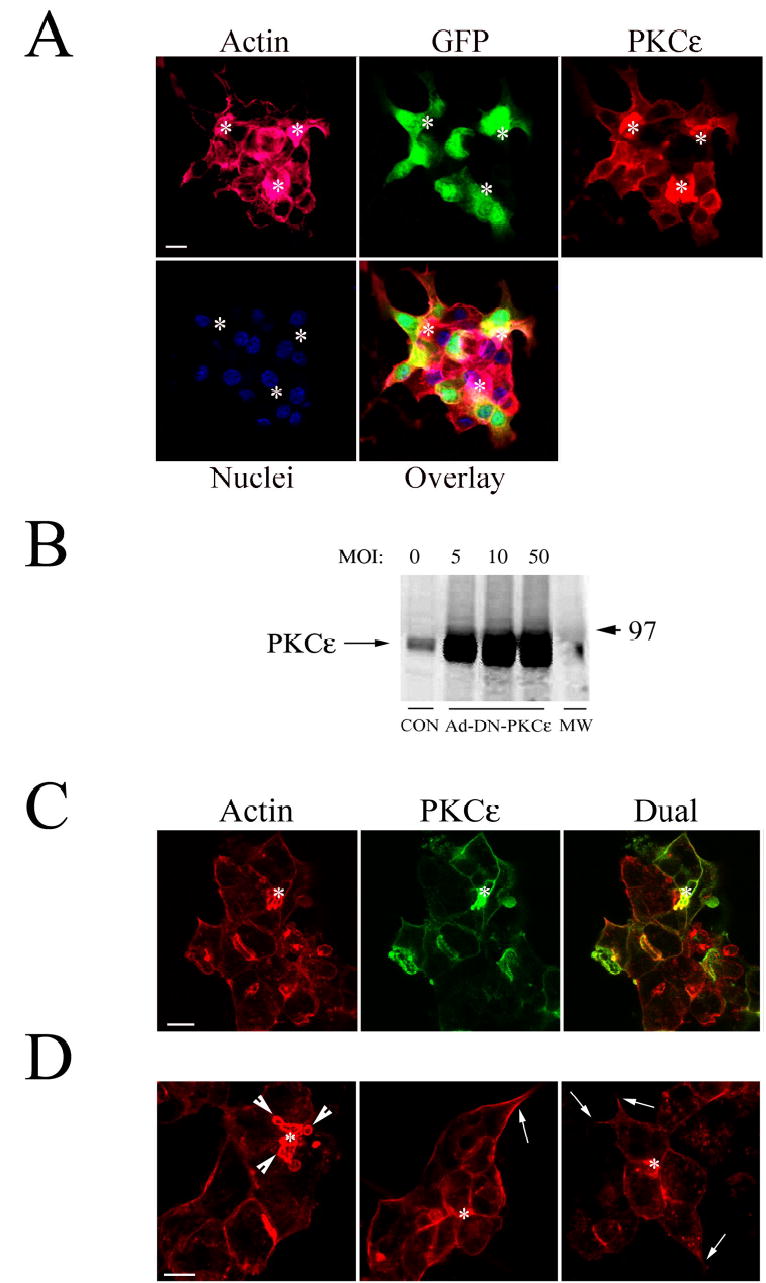
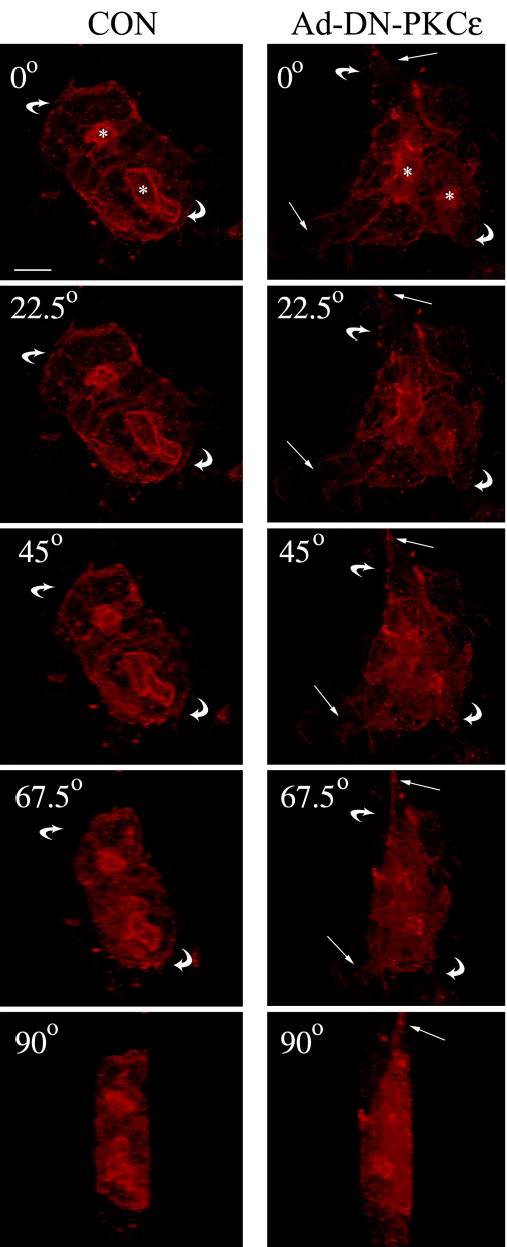
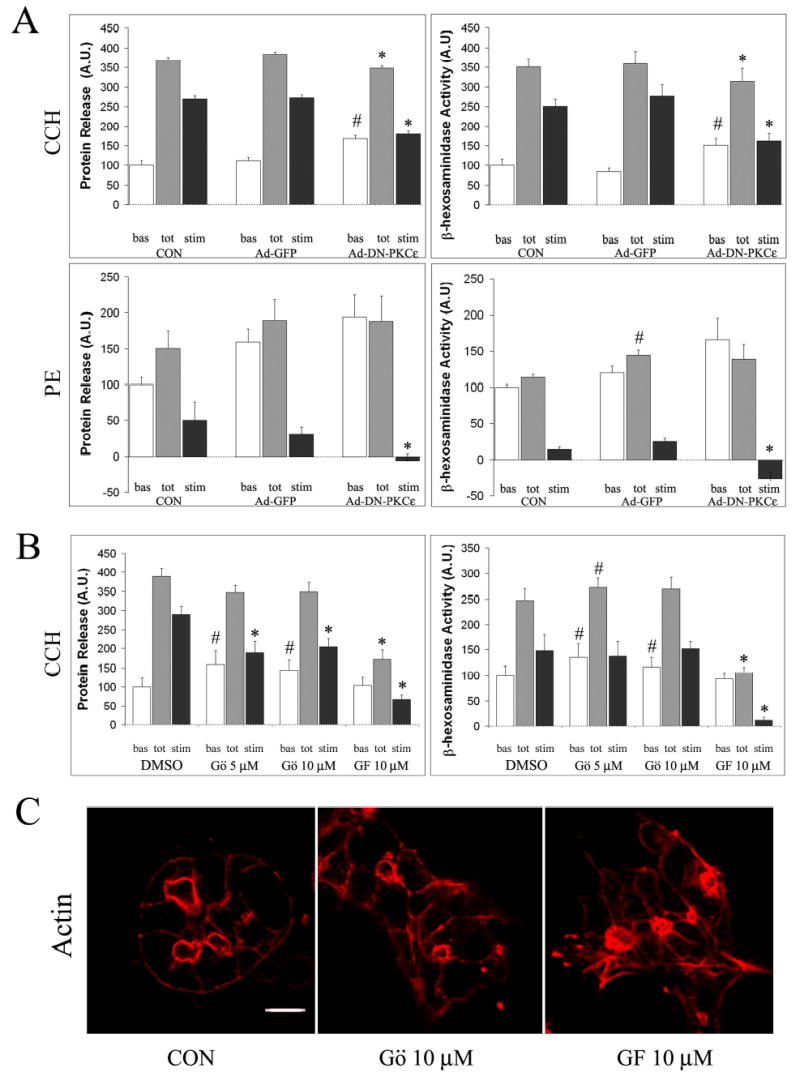
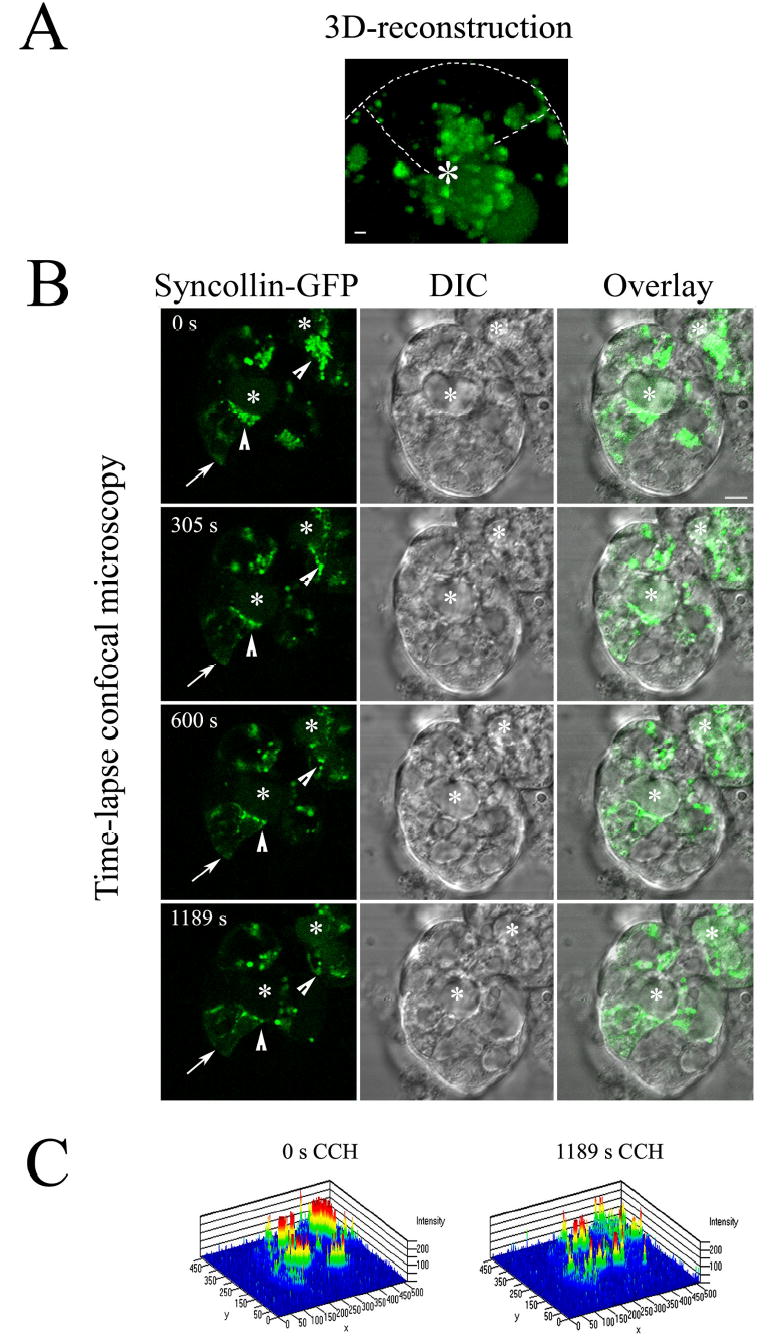
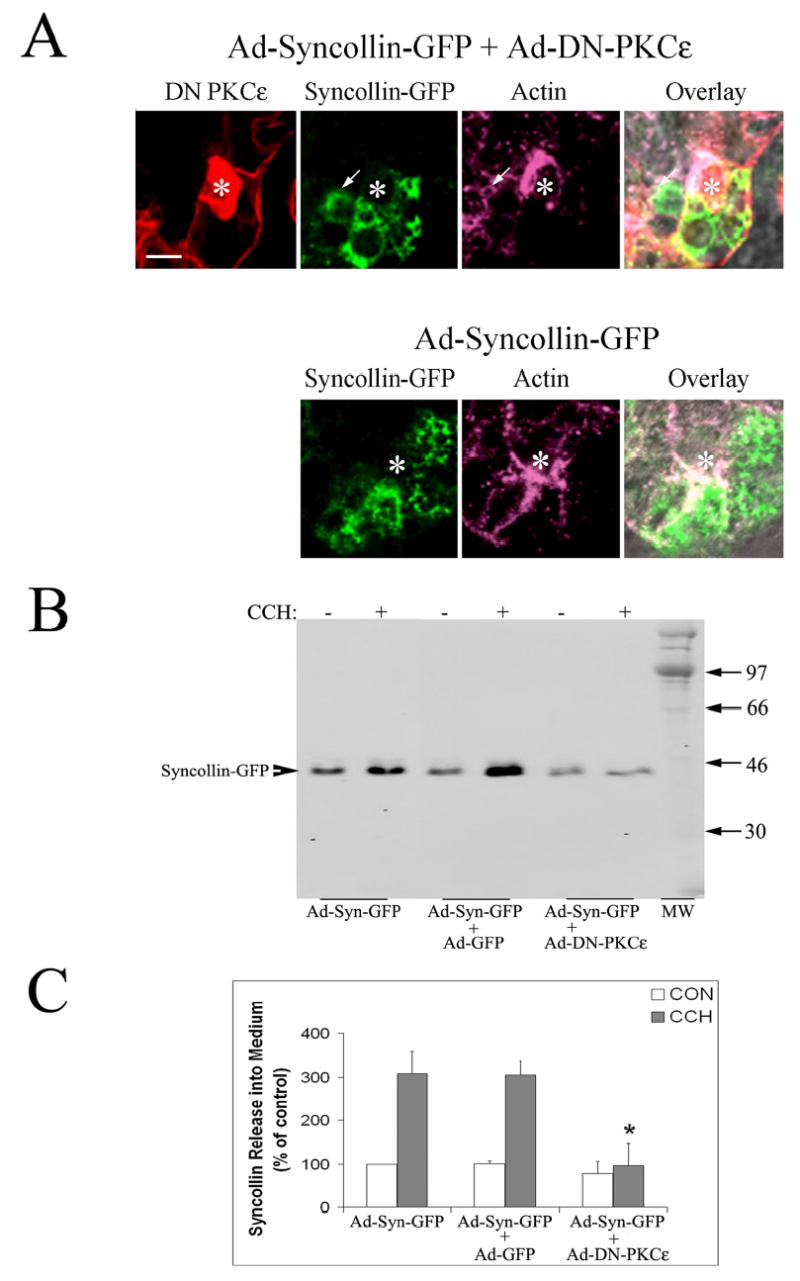
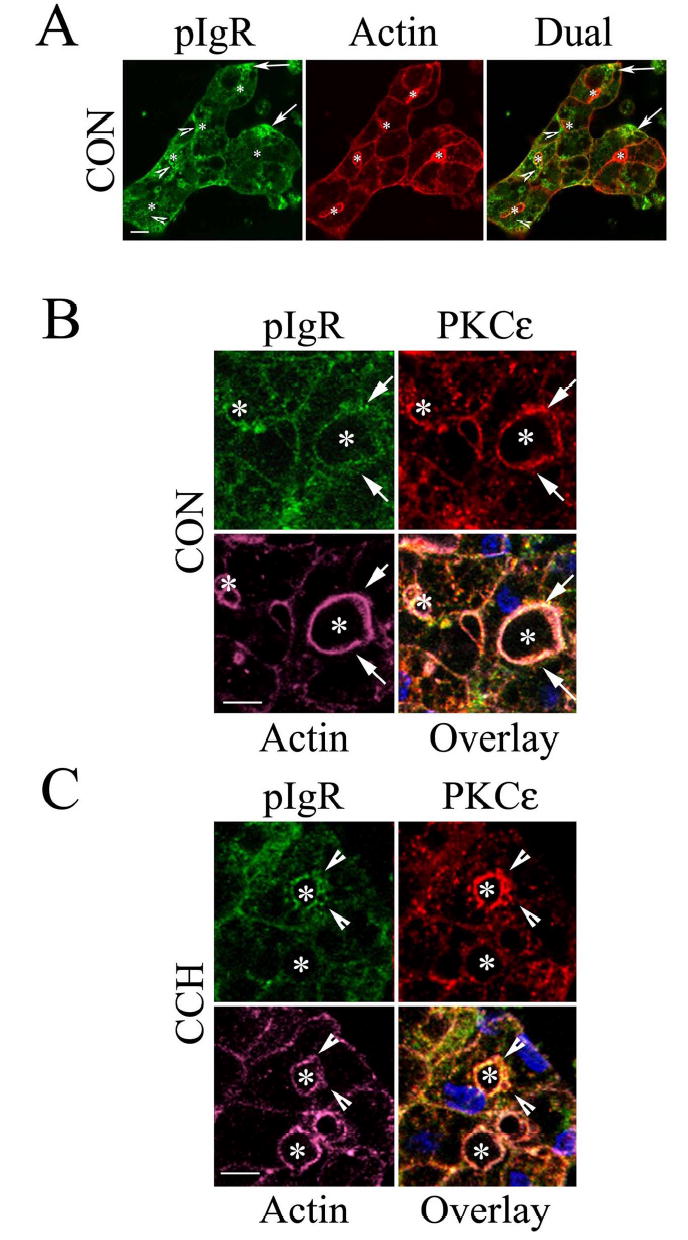
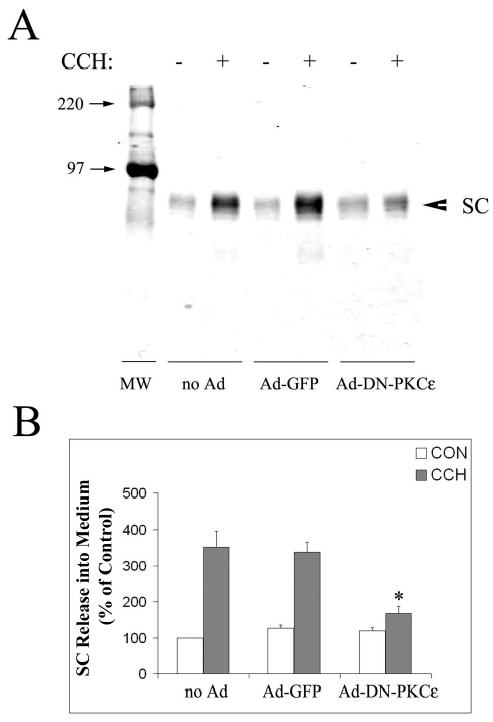
We investigated the involvement of PKC-epsilon in apical actin remodeling in carbachol-stimulated exocytosis in reconstituted rabbit lacrimal acinar cells. Lacrimal acinar PKC-epsilon cosedimented with actin filaments in an actin filament binding assay. Stimulation of acini with carbachol (100 microM, 2-15 min) significantly (P < or = 0.05) increased PKC-epsilon recovery with actin filaments in two distinct biochemical assays, and confocal fluorescence microscopy showed a significant increase in PKC-epsilon association with apical actin in stimulated acini as evidenced by quantitative colocalization analysis. Overexpression of dominant-negative (DN) PKC-epsilon in lacrimal acini with replication-defective adenovirus (Ad) resulted in profound alterations in apical and basolateral actin filaments while significantly inhibiting carbachol-stimulated secretion of bulk protein and beta-hexosaminidase. The chemical inhibitor GF-109203X (10 microM, 3 h), which inhibits PKC-alpha, -beta, -delta, and -epsilon, also elicited more potent inhibition of carbachol-stimulated secretion relative to Gö-6976 (10 microM, 3 h), which inhibits only PKC-alpha and -beta. Transduction of lacrimal acini with Ad encoding syncollin-green fluorescent protein (GFP) resulted in labeling of secretory vesicles that were discharged in response to carbachol stimulation, whereas cotransduction of acini with Ad-DN-PKC-epsilon significantly inhibited carbachol-stimulated release of syncollin-GFP. Carbachol also increased the recovery of secretory component in culture medium, whereas Ad-DN-PKC-epsilon transduction suppressed its carbachol-stimulated release. We propose that DN-PKC-epsilon alters lacrimal acinar apical actin remodeling, leading to inhibition of stimulated exocytosis and transcytosis.


Figures

Figure 1
Figure 1. PKCɛ is an actin binding protein in lacrimal acini
A. SDS-PAGE gel stained with Coomassie blue staining depicting the Supernatant (Sup) and Pellet fractions from actin-binding assays. Lysates from lacrimal acini (Lysate) were incubated without (−) or with (+) non-muscle actin and filaments were pelleted by centrifugation as described in Methods. α-Actinin (an actin-binding protein) and bovine serum albumin (BSA) were used as positive and negative controls, respectively. α-Actinin was pelleted with actin filaments (Arrow labeled Actinin showing its position in the Pellet fraction) while BSA was not (Arrow labeled BSA showing its position in the Sup fraction). A weaker protein signal showing a the major band with a MW corresponding to PKCɛ ~95kDa could also be detected in the Lysate lane in the Pellet fraction when non-muscle actin was added to the reaction (Arrow labeled PKCe). B. Western Blot analysis of the Pellet fraction from a representative actin-binding assay, when lysates (from equal amounts of cells) from acini stimulated without (CON) or with CCH for the indicated periods of time (2–15 min, 100 μM) were used for the actin binding assay and Pellet fractions were blotted for PKCɛ and actin as indicated. Duplicate samples were run in each assay as shown. C. Summary graph of actin-binding experiments in B. obtained from three independent preparations; *, significant at p ≤ 0.05. D. Acini without or with CCH (100 μM, 15 min) lacrimal acini were subjected to sequential detergent extraction to isolate soluble (Sol), membrane (Mem) and cytoskeletal (Cyt) pools as described in Methods. Equal volumes of each of the fractions were resolved by SDS-PAGE and the sample content of PKCɛ and actin determined by Western blotting. E. Composite values reflecting PKCɛ enrichment within soluble, membrane and cytoskeletal pools from acini without or with CCH as described in C. and expressed as a percentage of total cellular PKCɛ. Stimulation did not affect the recovery of marker proteins in the three fractions (data not shown). Results are from n=3 experiments; error bars represent sem; *, p ≤ 0.05.
Figure 2
Figure 2. Stimulation with carbachol increases PKCe colocalization with apical actin in lacrimal acini
A. Confocal micrographs of control (CON) and CCH-stimulated (CCH; 100 μM, 5 min) acini processed as described in Methods to label PKCe (green; rabbit polyclonal antibody to PKCe, secondary antibody- goat anti-rabbit-FITC) and actin (red; rhodamine phalloidin) which are displayed as separate signals and also as overlaid images. Red arrows across the images indicate the linear region of focus and the direction of the displayed signals from left to right for the intensity plots in B. *, lumenal regions and bars, 5 μm. B. Intensity plots showing the relative intensity of green (PKCe) and red (actin) fluorescence in the regions indicated from the images in A. Regions exhibiting coincident peaks are increased by CCH stimulation, suggestive of increased colocalization. C. Colocalization coefficients which express, for each marker, the number of colocalizing pixels over the number of total pixels, were calculated as described in Methods from unstimulated acini (CON) or acini exposed to CCH (5 min, 100 μM). The relative number of colocalizing pixels in channels 1 or 2, respectively, are expressed as compared to the total number of pixels above threshold. The value range is from 0 – 1 where 0 indicates no colocalization and 1 indicates that all pixels colocalize. All pixels above background count irrespective of their intensity. Results were obtained from 45 (CON) and 47 (CCH) lumena acquired randomly over n=4 separate preparations (7–20 lumena per preparation), *, significant at p ≤ 0.05.
Figure 3
Figure 3. High efficiency transduction of lacrimal acini with Ad-DN-PKCɛ results in co-localization of overexpressed DN-PKCɛ with actin filaments
A. PKCɛ (red), actin filaments (pink), nuclei (blue) and GFP (green) in acini transduced with Ad-DN-PKCɛ co-expressing GFP at an MOI of 5 and fixed and processed for quantitation of transduction efficiency as described in Methods. B. Western blot showing the expression of PKCɛ in lysates of lacrimal acini transduced with Ad-DN-PKCɛ at the indicated MOI. Equal amounts of protein were loaded in each lane. C. Confocal fluorescence micrographs of lacrimal acini transduced with Ad-DN-PKCɛ and fixed and processed as described in Methods to label actin filaments (red) and PKCɛ (green). Note, cytosolic GFP fluorescence co-expressed by the Ad-DN-PKCɛ construct is destroyed during fixation. D. Confocal fluorescence micrographs showing actin filament organization in lacrimal acini transduced with Ad-DN-PKCɛ. Arrowheads in C. and D. indicate accumulation of actin-coated structures at the APM; arrows point to basolateral actin filaments associated with areas of cell spreading and process formation; *, lumenal regions; bars, 5 μm in all panels.
Figure 4
Figure 4. Transduction of lacrimal acini with Ad-DN-PKCɛ is associated with changes in acinar shape
3D reconstruction of the actin filament network labeled with Alexa Fluor 647-phalloidin in non-transduced acini (CON, left panel) or acini transduced with Ad-DN-PKCɛ (right panel) as described in Methods. Images were acquired at Z intervals of 0.5 μm and were reconstructed into a 3D movie file which could be rotated to demonstrate the structure viewed at different angles. Selected frames are presented at 0°, 22.5 °, 45 °, 67.5 °, and 90 °. Straight arrows indicate projections at the basolateral side of acini; curved arrows indicate the direction of the rotation of the acinar projection; *, lumenal regions; bar, 5 μm.
Figure 5
Figure 5. PKCɛ inhibition impairs secretagogue-stimulated release of protein and β-hexosaminidase in lacrimal acini
A. Lacrimal acini grown on Matrigel-coated dishes were transduced with Ad-DN-PKCɛ or Ad-GFP on day 2 of culture as described in Methods and analyzed on day 3 for secretion. Bulk protein secretion and β-hexosaminidase activity released into culture medium from transduced acini exposed without or with CCH (100 μM, 30 min) or PE (100 μM, 30 min) is shown. B. Lacrimal acini grown on Matrigel-coated dishes were treated with Gö 6976 (Gö, 5 or 10 μM) or GF 109203X (GF, 10 μM) for 3 hours prior to stimulation with CCH (100 μM, 30 min). Bulk protein and β-hexosaminidase activity released into culture medium is shown. In A. and B., basal (unstimulated) release is shown in white bars; total release (basal plus stimulated) is shown in grey bars; the stimulated component (total minus basal) is shown in black bars. Values were normalized to cell protein before comparison across samples. n=7 separate preparations for CCH stimulation and 4 separate preparations for PE stimulation in acini transduced with Ad-DN-PKCe or Ad-GFP; n=5 separate preparations for acini treated with Gö 6976 or GF 109203X; error bars represent sem; *, significant decrease at p ≤ 0.05 from paired control; #, significant increase at p ≤ 0.05 from paired control; &, significant decrease at p ≤ 0.05 from Gö 6976-treated, CCH-stimulated acini. C. Confocal fluorescence micrographs of lacrimal acini without (Control or CON) or with treatment with Gö 6976 (10 μM, 3 hrs) or GF 109203X (10 μM, 3 hrs) fixed and processed for labeling of actin filaments with rhodamine phalloidin as described in Methods. Bar, 5 μm.
Figure 6
Figure 6. CCH stimulation of lacrimal acini transduced with Ad-syncollin-GFP depletes subapical syncollin-GFP fluorescence
Lacrimal acini grown on Matrigel-covered glass-bottomed round 35 mm dishes were transduced with Ad-syncollin-GFP on day 2 of culture as described in Methods and imaged on day 3 of culture. A. 3D reconstruction at high magnification of the interior regions of a reconstituted acinus formed by three lacrimal acinar cells organized around a central lumen (*), each expressing syncollin-GFP. The reconstruction was obtained by compression of XY images acquired at Z intervals of 0.5 μm. Bar, 1 μm; dashed line, boundary of uppermost cell relative to the other two, deduced by comparison to DIC image. B. Live acini were imaged in the presence of CCH (100 μM) at the indicated times by time-lapse confocal fluorescence microscopy. Arrowheads indicate regions of major loss of syncollin-GFP intensity surrounding lumenal regions (*); bar, 5 μm. No major changes in syncollin-GFP intensity were observed when acini were imaged without CCH. C. 2.5 D graphical reconstruction of the overall intensity profile of the imaged areas presented in A. at 0 and 1189 sec of stimulation with CCH, illustrating individual intensities per pixel utilizing the rainbow scale. The resolution is ~10 pixels per micron.
Figure 7
Figure 7. DN-PKCɛ inhibits CCH-stimulated release of syncollin-GFP into culture medium in co-transduced lacrimal acini
A. High magnification view of the APM region of acini co-transduced with Ad-syncollin-GFP and Ad-DN-PKCɛ, or Ad-syncollin-GFP alone. Transduced acini were fixed and labeled as described in Methods to detect syncollin (green), PKCɛ (red), and actin filaments (purple). Overlay shows all three fluorescence labels as well as the paired DIC image. Fixation quenches the intrinsic GFP fluorescence present in cytosol and on syncollin in these transduced acini. *, lumenal region; arrow, co-localization of syncollin-GFP with an actin-coated invagination; bar, 5 μm. B. Western blots showing syncollin-GFP release into culture medium in the absence (−) and presence (+) of 100 μM CCH for 30 min in lacrimal acini transduced with Ad-syncollin-GFP without or with Ad-GFP or Ad-DN-PKCɛ. Syncollin release was detected with an anti-syncollin antibody combined with an appropriate IRDye™800 conjugated secondary antibody. C. Syncollin-GFP release under each experimental condition was quantified as shown in A., normalized to cell protein in the pellet, and compared across treatments. White bars show basal (CON) release while grey bars show CCH-stimulated release. N=3 separate preparations; error bars show sem and *, significant at p ≤ 0.05 from samples co-transduced with Ad-GFP.
Figure 8
Figure 8. pIgR is enriched with actin and PKCɛ at the APM in lacrimal acini
A. Lacrimal acini were fixed and processed as described in Methods to label pIgR (green) and actin filaments (red) for detection by confocal fluorescence microscopy. Arrows, basolateral labeling; arrowheads labeling around lumenal regions. *, lumenal regions. B. High magnification view of the APM region of control (CON) lacrimal acini labeled as described in Methods to detect pIgR (green), PKCɛ (red), and actin filaments (purple). The triple overlay reveals extensive co-localization of all three constituents together at the APM (arrows) and *, lumenal region. C. High magnification view of the APM region of CCH-stimulated (100 μM, 5 min) acini fixed and processed as in B. The triple overlay shows actin-coated invaginations co-localized with pIgR and PKCɛ (arrowheads) and *, lumenal region. Bars, 5 μm.
Figure 9
Figure 9. Transduction with Ad-DN-PKCɛ inhibits CCH-stimulated release of SC from lacrimal acini
A. Western blots showing SC release into culture medium in the absence (−) and presence (+) of 100 μM CCH for 30 min in non-transduced acini (no Ad), or acini transduced with Ad-GFP or Ad-DN-PKCɛ. SC release was detected with an antibody to the extracellular, cleaved domain of pIgR combined with an appropriate IRDye™800 conjugated secondary antibody. B. SC release under each condition was quantified as shown in A., normalized to cell protein in the pellet, and compared across treatments. White bars show control (CON) release while grey bars show CCH-stimulated release. N=3 separate preparations; error bars show sem and *, significant at p ≤ 0.05 from samples co-transduced with Ad-GFP.

Similar articles

Cited by

References

    1. Akita Y, Ohno S, Yajima Y, Konno Y, Saido TC, Mizuno K. Overproduction of a Ca2+-independent protein kinase C isozyme, nPKC epsilon, increases the secretion of prolactin from thyrotropin-releasing hormone-stimulated rat pituitary GH4C1 cells. J Biol Chem. 1994;269:4653–3660. - PubMed
    1. Akita Y. Protein kinase C-ɛ (PKC-ɛ): its unique structure and function. J Biochem. 2002;132:847–852. - PubMed
    1. Aksoy E, Goldman M, Willems F. Protein kinase C epsilon: a new target to control inflammation and immune-mediated disorders. Int J Biochem Cell Biol. 2003;36:183–188. - PubMed
    1. Bastani B, Yang L, Baldassare JJ, Pollo DA, Gardner JD. Cellular distribution of isoforms of protein kinase C (PKC) in pancreatic acini. Biochim Biophys Acta. 1995;1269:307–15. - PubMed
    1. Berrier AL, Mastrangelo AM, Downward J, Ginsberg M, LaFlamme SE. Activated R-Ras, Rac1, PI 3-kinase and PKCɛ can each restore cell spreading inhibited by isolated integrin β1 cytoplasmic domains. J Cell Biol. 2000;151:1549–1560. - PMC - PubMed

Publication types

LinkOut - more resources