

Prediction of lymph node metastasis by analysis of gene expression profiles in primary lung adenocarcinomas
- PMID: 15930348
- PMCID: PMC2211271
- DOI: 10.1158/1078-0432.CCR-04-2525
Prediction of lymph node metastasis by analysis of gene expression profiles in primary lung adenocarcinomas
Abstract
Purpose: Lymph node status is a strong predictor of outcome for lung cancer patients. Recently, several reports have hinted that gene expression profiles of primary tumor may be able to predict node status. The goals of this study were to determine if microarray data could be used to accurately classify patients with regard to pathologic lymph node status, and to determine if this analysis could identify patients at risk for occult disease and worse survival.
Experimental design: Two previously published lung adenocarcinoma microarray data sets were reanalyzed. Patients were separated into two groups based on pathologic lymph node positive (pN+) or negative (pN0) status, and prediction analysis of microarray (PAM) was used for training and validation to classify nodal status. Overall survival analysis was performed based on PAM classifications.
Results: In the training phase, a 318-gene set gave classification accuracy of 88.4% when compared with pathology. Survival was significantly worse in PAM-positive compared with PAM-negative patients overall (P < 0.0001) and also when confined to pN0 patients only (P = 0.0037). In the validation set, classification accuracy was again 94.1% in the pN+ patients but only 21.2% in the pN0 patients. However, among the pN0 patients, recurrence rates and overall survival were significantly worse in the PAM-positive compared with PAM-negative patients (P = 0.0258 and 0.0507).
Conclusions: Analysis of gene expression profiles from primary tumor may predict lymph node status but frequently misclassifies pN0 patients as node positive. Recurrence rates and overall survival are worse in these "misclassified" patients, implying that they may in fact have occult disease spread.
Figures
 ) and pN0 (
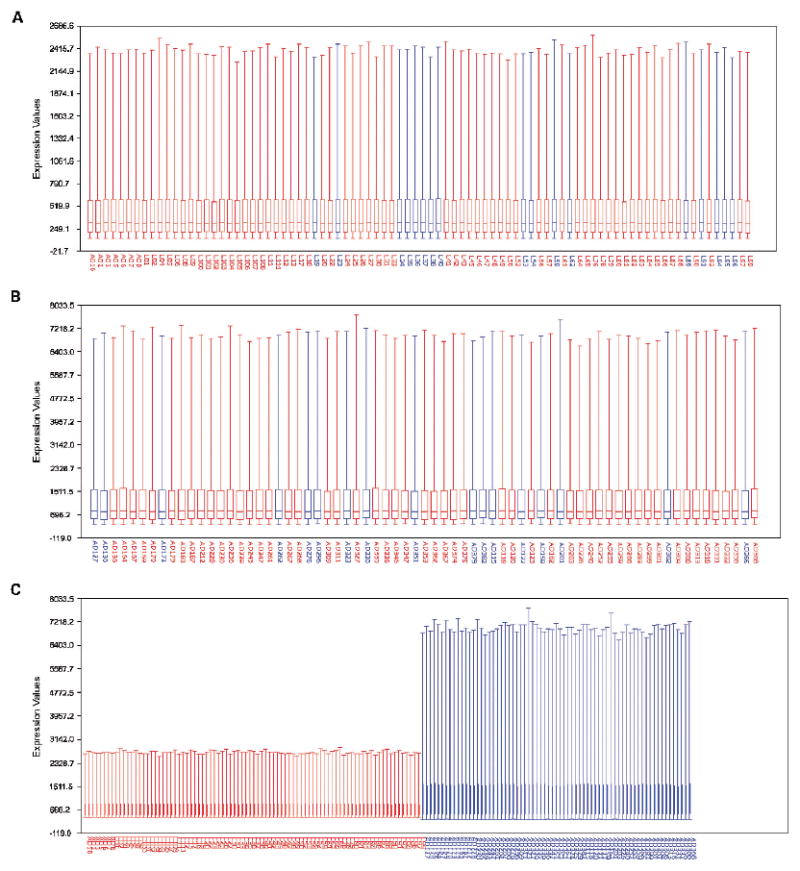
 ) groups in Michigan data set. B, data from pN+ and pN0 groups in Harvard data set. C, data from both data sets plotted together;
, Harvard;
, Michigan.
) groups in Michigan data set. B, data from pN+ and pN0 groups in Harvard data set. C, data from both data sets plotted together;
, Harvard;
, Michigan.
 , (pN+) with the Y axis indicating the probability associated with the classification of each patient.
References
-
- Boring CC, Squires TS, Tong T, Montgomery S. Cancer statistics, 1994. CA Cancer J Clin. 1994;44:7–26. - PubMed
-
- De Vita VT, Jr, Hellman S, Rosenberg SA. Cancer: principles and practice of oncology. 6. Philadelphia: Lippincott Williams & Wilkins; 2001.
-
- Coello MC, Luketich JD, Litle VR, Godfrey TE. Prognostic significance of micrometastasis in non-small-cell lung cancer. Clin Lung Cancer. 2004;5:214–25. - PubMed
-
- Beer DG, Kardia SL, Huang CC, et al. Gene-expression profiles predict survival of patients with lung adenocarcinoma. Nat Med. 2002;8:816–24. - PubMed
-
- Naruke T, Goya T, Tsuchiya R, Suemasu K. Prognosis and survival in resected lung carcinoma based on the new international staging system. J Thorac Cardiovasc Surg. 1988;96:440–7. - PubMed
Publication types
MeSH terms
Grants and funding
LinkOut - more resources
Full Text Sources
Medical
Miscellaneous
