. 2005 Jun 1;25(22):5438-45.
doi: 10.1523/JNEUROSCI.1117-05.2005.

The primordial, blue-cone color system of the mouse retina

Affiliations

The primordial, blue-cone color system of the mouse retina

Silke Haverkamp et al. J Neurosci. .

Abstract

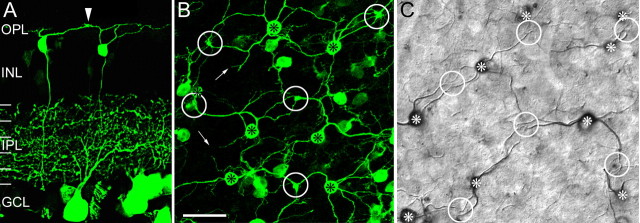
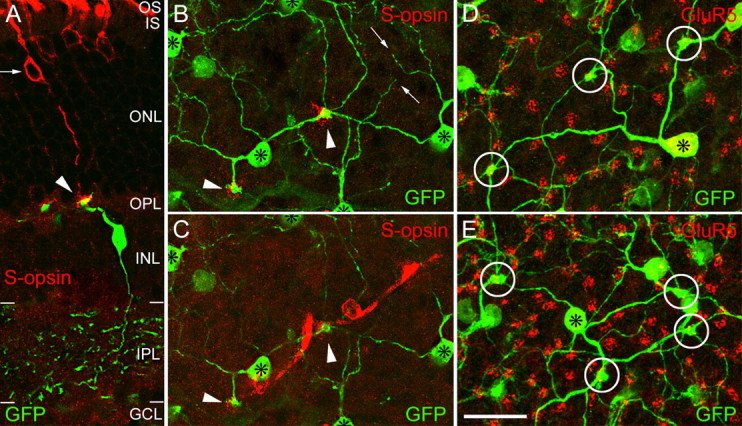
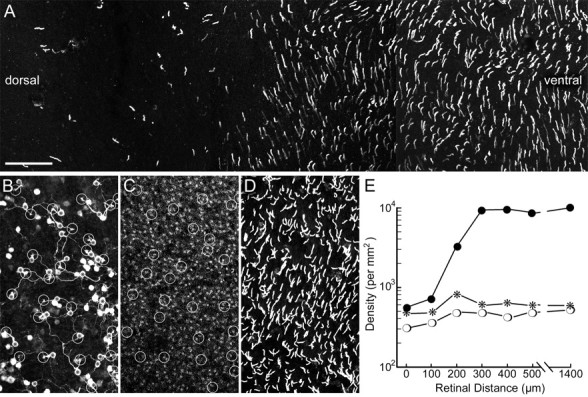
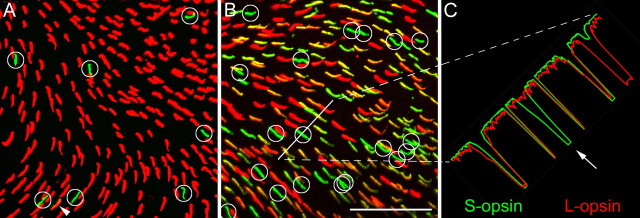
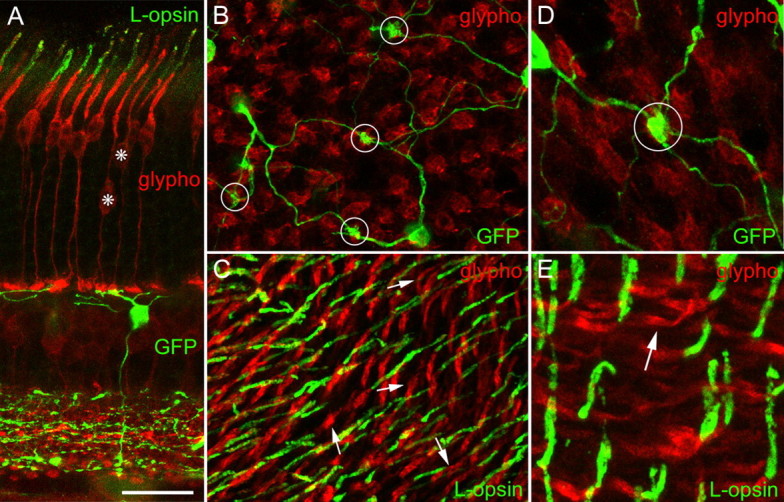
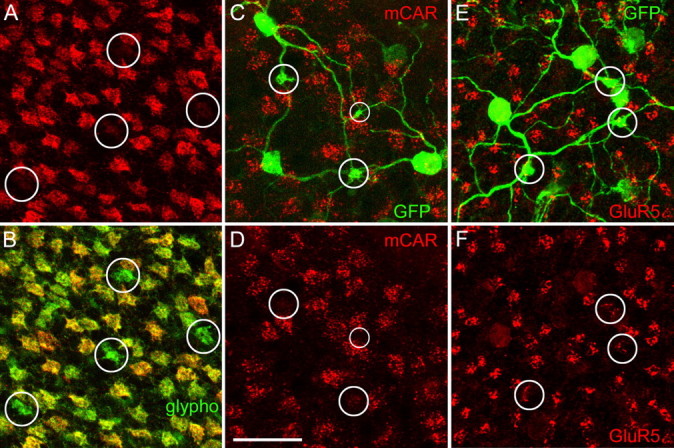
Humans and old world primates have trichromatic color vision based on three spectral types of cone [long-wavelength (L-), middle-wavelength (M-), and short-wavelength (S-) cones]. All other placental mammals are dichromats, and their color vision depends on the comparison of L- and S-cone signals; however, their cone-selective retinal circuitry is still unknown. Here, we identified the S-cone-selective (blue cone) bipolar cells of the mouse retina. They were labeled in a transgenic mouse expressing Clomeleon, a chloride-sensitive fluorescent protein, under the control of the thy1 promoter. Blue-cone bipolar cells comprise only 1-2% of the bipolar cell population, and their dendrites selectively contact S-opsin-expressing cones. In the dorsal half of the mouse retina, only 3-5% of the cones express S-opsin, and they are all contacted by blue-cone bipolar cells, whereas all L-opsin-expressing cones (approximately 95%) are avoided. In the ventral mouse retina, the great majority of cones express both S- and L-opsin. They are not contacted by blue-cone bipolar cells. A minority of ventral cones express S-opsin only, and they are selectively contacted by blue-cone bipolar cells. We suggest that these are genuine S-cones. In contrast to the other cones, their pedicles contain only low amounts of cone arrestin. The blue-cone bipolar cells of the mouse retina and their cone selectivity are closely similar to primate blue-cone bipolars, and we suggest that they both represent the phylogenetically ancient color system of the mammalian retina.


Figures

Figure 1.
Figure 1.
Blue-cone bipolar cells of the mouse and the macaque monkey retina. A, Vertical view of Clomeleon/GFP-labeled cells in a vibratome section through the retina of a Clomeleon-expressing mouse (confocal stack, collapsed into a single plane). GCL, Ganglion cell layer. Many ganglion cells and their dendrites in the IPL are labeled. Two bipolar cells are also labeled. Their cell bodies are in the outer INL, and their axons descend into the innermost IPL, where they terminate in small axonal varicosities (left cell). Originating from the cell body are several fine, long dendrites that converge onto a putative cone pedicle (arrowhead). B, Horizontal view of the bipolar cells in a whole-mounted retina (dorsal retina, confocal stack, collapsed into a single plane). The cell bodies of putative blue-cone bipolar cells are indicated by asterisks. Long, meandering dendrites originate from the cell bodies and converge onto putative cone pedicles (circles). Blind endings are marked by the small arrows. They are confined to the outer INL. C, Horizontal view of blue-cone bipolar cells in a whole-mounted macaque monkey retina that was immunostained for CCK (Nomarski micrograph, immunoperoxidase staining) (for additional details, see Wässle et al., 1994). Cell bodies of blue-cone bipolar cells are marked by asterisks, and putative S-cone pedicles are marked by circles. Scale bar: (in B) A, 28.7 μm; B, C, 20 μm.
Figure 2.
Figure 2.
Blue-cone bipolar cells selectively contact S-opsin-expressing cones. A, Vertical view of a blue-cone bipolar cell (green) contacting a cone (red) that expresses S-opsin (ventral retina, single optical section). The arrow points to the cell body of the cone; the arrowhead points to the cone pedicle. OS, Outer segments; IS, inner segments; ONL, outer nuclear layer; GCL, ganglion cell layer. B and C show the same field from the dorsal part of a whole-mounted retina that was double labeled for Clomeleon/GFP (green) and for S-opsin (red). B, In this view (collapsed confocal stack of the INL and OPL), the cell bodies of the blue-cone bipolars (*) and their long dendrites are shown. Two S-opsin-expressing pedicles (red) are marked by arrowheads. Blind endings are marked by the small arrows. They are confined to the INL. C, In this view (collapsed confocal stack of the outer retina), two S-opsin-expressing cones, their pedicles, cell bodies, and outer segments are shown in red. The pedicles (arrowheads) are contacted by the dendrites of the blue-cone bipolar cells. D, E, Horizontal views of two different areas of a whole-mounted retina (collapsed confocal stacks) double labeled for Clomeleon/GFP (green) and for GluR5 (red). The clusters of GluR5 puncta represent individual cone pedicles. D, The dendrites of the blue-cone bipolar cell (*) contact three cone pedicles (circles) and avoid all other pedicles (n = 51). E, The blue-cone bipolar cell in the center (*) contacts four cone pedicles in this field and avoids all other cone pedicles (n = 78). Scale bar: (in E) 20 μm.
Figure 3.
Figure 3.
Distribution of blue cones across the mouse retina. A, Horizontal view of S-opsin-expressing cone outer segments in a whole-mounted mouse retina. In the dorsal retina (left), only few cones express S-opsin; in the ventral retina, the vast majority of cones express S-opsin (right). B, C, and D show the same field from the ventral retina that was immunolabeled for GFP, kinesin and GluR5, and S-opsin. B, Clomeleon/GFP-immunoreactive bipolar cells. The blue-cone bipolar cells (n = 30) and their cone pedicle contacts (n = 28) are marked by asterisks and circles, respectively. C, The ribbons of rod spherules and cone pedicles were revealed here with antibodies against kinesin (Muresan et al., 1999). However, in the mouse retina, it is difficult to recognize cone pedicles in kinesin-labeled whole mounts. Therefore, they were made visible in addition by an antibody against GluR5 (Haverkamp et al., 2001). Both kinesin and GluR5 antisera were recognized by Cy3-coupled secondary antibodies. All together, 528 cone pedicles can be found in C, and those that are contacted in B are encircled. D, All together, 493 S-opsin-expressing cones are found in this patch of retina. Comparable fields were evaluated along a dorsoventral intersect, and the graph in E shows the changes in density along the zone of transition between dorsal and ventral retina. E, The abscissa shows the retinal distance: 0 corresponds to the left part, 500 μm to the right part of A. At a distance of 1400 μm, a field far in the ventral retina was measured. The ordinate shows density on a logarithmic scale. Open circles represent cone pedicles contacted by blue-cone bipolar cells, asterisks represent blue-bipolar cells, and filled circles represent S-opsin-expressing cones. Measurements from 17 fields taken from four retinas showed that the density ratio of blue-cone bipolar cells to blue-cone pedicles was 1.17 ± 0.1 (mean ± SD). Scale bar: (in A) A, 50 μm; B-D, 66 μm.
Figure 4.
Figure 4.
S-opsin and L-opsin expression in the mouse retina. Horizontal view of a whole-mounted retina with the focus on the cone outer segments. The retina was double immunostained for S-opsin (green) and L-opsin (red). As described in Materials and Methods, the label in the outer segment was quantified by a line scan measuring the intensities in the red and green channels. The hue of the outer segments in the two micrographs is only an approximation of the relative intensities. A, Field from the dorsal retina. Most cones (n = 238) express L-opsin (red), and only few cones (n = 7; marked by circles) express S-opsin (green). One cone (arrowhead) was double labeled. B, Field from the ventral retina (300 μm away from the zone of transition). Most cones (n = 189) express various amounts of both S- and L-opsin. The cones marked by circles (n = 19) express only S-opsin; the remaining 57 cones express only L-cone opsin. C, A line scan was performed along the oblique white line in B. The line scan intersects four cone outer segments and the white circle. The cone within the white circle (arrow) expresses S-opsin but no significant amount of L-opsin. Scale bar: (in B) 50 μm.
Figure 5.
Figure 5.
Genuine blue cones do not express detectable amounts of L-opsin. A, Vertical section of dorsal mouse retina immunostained for glycogen phosphorylase (glypho; red), L-opsin (outer segments; green), and GFP (bipolar cell and IPL; green) (confocal stack of a vibratome section, collapsed into 1 plane). The two cones (*) contacted by the blue-cone bipolar cell do not express L-opsin in their outer segments. B and C show the same field of the dorsal retina of a whole mount of the mouse retina that was triple labeled for GFP (green), glypho (red), and L-opsin (green). A confocal stack was taken from the OPL to the outer segments, and two optical sections are presented. B, With the focus in the OPL, dendrites of blue-cone bipolar cells converging onto four cone pedicles (circles) can be seen. By gradually moving the plane of focus to the outer segments, it was possible to follow an individual cone all the way from the pedicle to its outer segment. C, With the focus in the plane of the outer segments, L-opsin expression (green) can be detected. The four cones identified in B express no L-opsin in their outer segments (arrows). D and E show a field from the dorsal retina at higher magnification. D, The cone pedicle contacted by blue bipolar cell dendrites is encircled. E, The outer segment of this cone (arrow) does not express L-opsin. Scale bar: (in A) A-C, 20 μm; D, E, 11 μm.
Figure 6.
Figure 6.
Characterization of genuine S-cone pedicles. All micrographs show horizontal views of whole-mounted retinas with the focus on the outer plexiform layer. A and B show a retina that was double labeled for mCAR (red) and glycogen phosphorylase (glypho; green). A, The mCAR-immunoreactive cone pedicles form a regular mosaic, with the encircled pedicles being only very faintly labeled. B, Same field as in A, mCAR immunoreactivity in red, glypho immunoreactivity in green. The four cone pedicles encircled in A are strongly glypho positive. C and D show a retina that was double labeled for mCAR (red) and for Clomeleon/GFP (green). C, Three putative true S-cone pedicles (circles) are defined by the convergence of blue-cone bipolar cell dendrites (green). Cone pedicles are labeled for mCAR (red). D, mCAR-immunolabeled cone pedicles. The expression mCAR is very weak at the true S-cone pedicles (circles). E and F show a retina that was double labeled for Clomeleon/GFP (green) and for the kainate receptor subunit GluR5 (red). E, Three putative true S-cone pedicles are encircled. F, At the position of the true S-cone pedicles, the numbers of GluR5 puncta are significantly reduced. Scale bar: (in D) 20 μm.

References

    1. Ahnelt PK, Kolb H (2000) The mammalian photoreceptor mosaic-adaptive design. Prog Retin Eye Res 19: 711-777. - PubMed
    1. Applebury ML, Antoch MP, Baxter LC, Chun LLY, Falk JD, Farhangfar F, Kage K, Krzystolik MG, Lyass LA, Robbins JT (2000) The murine cone photoreceptor: a single cone type expresses both S and M opsins with retinal spatial patterning. Neuron 27: 513-523. - PubMed
    1. Calkins DJ, Sterling P (1999) Evidence that circuits for spatial and color vision segregate at the first retinal synapse. Neuron 24: 313-321. - PubMed
    1. Cohen E, Sterling P (1990) Convergence and divergence of cones onto bipolar cells in the central area of cat retina. Philos Trans R Soc Lond B Biol Sci 330: 323-328. - PubMed
    1. Dacey DM (2000) Parallel pathways for spectral coding in primate retina. Annu Rev Neurosci 23: 743-775. - PubMed

Publication types

LinkOut - more resources