. 2005 Jun;15(6):809-19.
doi: 10.1101/gr.3368805.

Operon formation is driven by co-regulation and not by horizontal gene transfer

Affiliations

Operon formation is driven by co-regulation and not by horizontal gene transfer

Morgan N Price et al. Genome Res. 2005 Jun.

Abstract

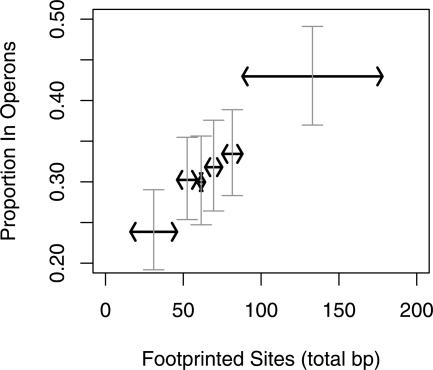
The organization of bacterial genes into operons was originally ascribed to the benefits of co-regulation. More recently, the "selfish operon" model, in which operons are formed by repeated gain and loss of genes, was proposed. Indeed, operons are often subject to horizontal gene transfer (HGT). On the other hand, non-HGT genes are particularly likely to be in operons. To clarify whether HGT is involved in operon formation, we identified recently formed operons in Escherichia coli K12. We show that genes that have homologs in distantly related bacteria but not in close relatives of E. coli--indicating HGT--form new operons at about the same rates as native genes. Furthermore, genes in new operons are no more likely than other genes to have phylogenetic trees that are inconsistent with the species tree. In contrast, essential genes and ubiquitous genes without paralogs--genes believed to undergo HGT rarely--often form new operons. We conclude that HGT is not a cause of operon formation but instead promotes the prevalence of pre-existing operons. To explain operon formation, we propose that new operons reduce the amount of regulatory information required to specify optimal expression patterns and infer that operons should be more likely to evolve than independent promoters when regulation is complex. Consistent with this hypothesis, operons have greater amounts of conserved regulatory sequences than do individually transcribed genes.


Figures

Figure 1.
Figure 1.
The evolutionary history of genes and operons. For each gene in E. coli K12, we determined which groups of genomes contained a potential ortholog of that gene and classified genes as native, HGT, or ORFan. We performed a similar analysis on each adjacent pair of genes predicted to be in the same operon and classified pairs as ancestral, imported, or new. Some genes and pairs could not be classified. We show examples of patterns of presence or absence for each class of gene and for each class of operon pair. The placement of the genomes at varying distances from E. coli K12 is in accordance with generally accepted phylogenies and with a whole-genome protein sequence tree (P. Dehal and E.J. Alm, unpubl.). “Other enterics” includes Yersinia, Buchnera, and Wigglesworthia species; “HPVS” includes Haemophilus, Pasteurella, Vibrio, and Shewanella species; and “other γ-Proteobacteria” includes Pseudomonas, Xanthomonas, and Xylella species. For the inferred histories to be correct, the union of all groups up to a given age must be monophyletic, but each outgroup need not be. For example, we believe that HPVS and the Enterobacteria together form a monophyletic clade but not HPVS by themselves.
Figure 2.
Figure 2.
HGT genes are not particularly likely to be in operons. For each class of gene, solid bars show the proportion that are in predicted operons. Error bars show 90% confidence intervals from the binomial test; if two error bars do not overlap, then the corresponding classes have significantly different probabilities of being in operons (P < 0.05).
Figure 3.
Figure 3.
Genes with more conserved upstream sequences are more likely to be in operons. For each E. coli gene with one or more sites from phylogenetic footprinting (McCue et al. 2002), we asked whether it was predicted to be at the beginning of a multi-gene operon or to be transcribed by itself. For each group of genes with varying amounts of footprinted sequence, as measured in total base pairs and indicated with the horizontal arrows, the y-axis shows the proportion of genes that are in operons. (These ranges were chosen to give the same number of genes in each range.) For each range, a vertical bar shows the 90% confidence interval for the proportion (from the binomial test). Genes in the middle or at the end of predicted operons were excluded from this analysis, which is why the proportion of genes in operons is lower than in Figure 2.

References

    1. Allen, T.E., Herrgard, M.J., Liu, M., Qiu, Y., Glasner, J.D., Blattner, F.R., and Palsson, B.Ø. 2003. Genome-scale analysis of the uses of the Escherichia coli genome: Model-driven analysis of heterogeneous data sets. J. Bacteriol. 185: 6392-6399. - PMC - PubMed
    1. Bulyk, M.L., McGuire, A.M., Masuda, N. and Church, G.M. 2004. A motif co-occurrence approach for genome-wide prediction of transcription-factor-binding sites in Escherichia coli. Genome Res. 14: 201-208. - PMC - PubMed
    1. Butland, G., Peregrin-Alvarez, J.M., Li, J., Yang, W., Yang, X., Canadien, V., Starostine, A., Richards, D., Beattie, B., Krogan, N., et al. 2005. Interaction network containing conserved and essential protein complexes in Escherichia coli. Nature 433: 531-537. - PubMed
    1. Cherry, J.L. 2003. Genome size and operon content. J. Theor. Biol. 221: 401-410. - PubMed
    1. Dandekar, T., Snel, B., Huynen, M., and Bork, P. 1998. Conservation of gene order: A fingerprint of proteins that physically interact. Trends Biochem. Sci. 23: 324-328. - PubMed

WEB SITE REFERENCES

    1. http://www.r-project.org/; the R statistics package.

Publication types

MeSH terms

Substances