. 2005 Jun;15(6):856-66.
doi: 10.1101/gr.3760605.

Discovering regulatory binding-site modules using rule-based learning

Affiliations

Discovering regulatory binding-site modules using rule-based learning

Torgeir R Hvidsten et al. Genome Res. 2005 Jun.

Abstract

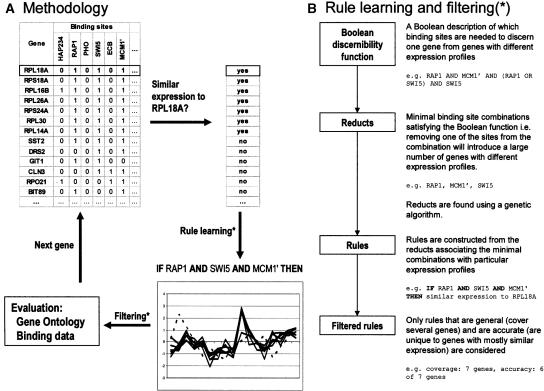
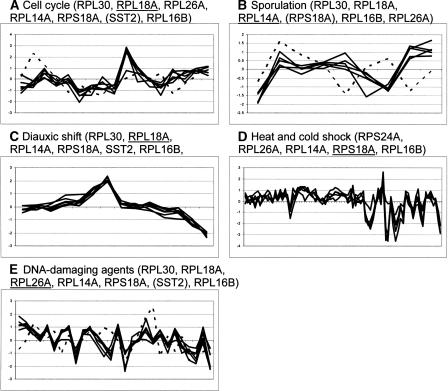
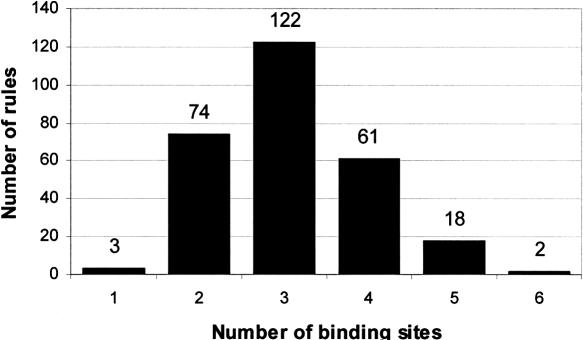
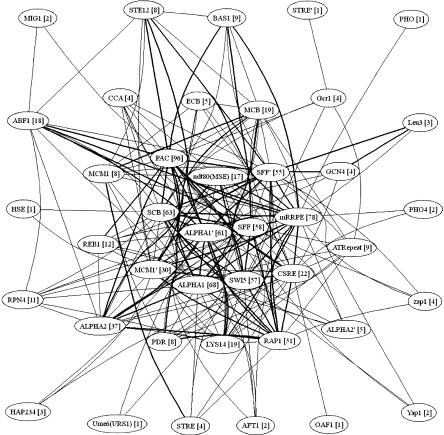
Transcription factors regulate expression by binding selectively to sequence sites in cis-regulatory regions of genes. It is therefore reasonable to assume that genes regulated by the same transcription factors should all contain the corresponding binding sites in their regulatory regions and exhibit similar expression profiles as measured by, for example, microarray technology. We have used this assumption to analyze genome-wide yeast binding-site and microarray expression data to reveal the combinatorial nature of gene regulation. We obtained IF-THEN rules linking binding-site combinations (binding-site modules) to genes with particular expression profiles, and thereby provided testable hypotheses on the combinatorial coregulation of gene expression. We showed that genes associated with such rules have a significantly higher probability of being bound by the same transcription factors, as indicated by a genome-wide location analysis, than genes associated with only common binding sites or similar expression. Furthermore, we also found that such genes were significantly more often biologically related in terms of Gene Ontology annotations than genes only associated with common binding sites or similar expression. We analyzed expression data collected under different sets of stress conditions and found many binding-site modules that are conserved over several of these condition sets, as well as modules that are specific to particular biological responses. Our results on the reoccurrence of binding sites in different modules provide specific data on how binding sites may be combined to allow a large number of expression outcomes using relatively few transcription factors.


Figures

Figure 1.
Figure 1.
A schematic description of the method and the rule learning algorithm. (A) Rules are induced from one gene at a time by first identifying similarly expressed genes and then by learning minimal binding-site combinations unique to these coexpressed genes. Filtered rules are finally evaluated using Gene Ontology and binding data by Lee et al. (2002). (B) The rule learning algorithm starts by building a Boolean function describing which binding sites are needed to discern one gene from genes with different expression profiles. This discernibility function is then simplified using a genetic algorithm in order to find minimal binding-site combinations (reducts) satisfying the function. Rules are constructed from the minimal combinations and filtered using accuracy and coverage. The examples given in B are constructed from the small table in A. The obtained reduct (RAP1, MCM1′, SWI5) is the minimal combination needed to discern RPL18A from genes with a different expression. Note that the set of similarly expressed genes in A is indiscernible from the differentially expressed gene SST2 with respect to the binding-site data. The set is thus said to be rough, and the resulting rule has an accuracy that is <1.
Figure 2.
Figure 2.
Expression profiles for the genes containing the three binding sites RAP1, SWI5, and MCM1′. The rule linking these binding sites to the expression profiles shown was induced from five expression data sets (i.e., all except pheromone). Each set of graphs is labeled with the expression condition set and with the list of genes for which expression profiles were available. Table 1 lists all eight genes with Gene Ontology annotations and transcription factor bindings. Each graph shows how the expression level of one gene varies over different measurement points. In A, B, and C, these measurement points correspond to time points, while in D and E, they also correspond to other relevant conditions: see individual publications for details. The central genes (i.e., genes for which a rule was induced) are underlined. Genes that did not satisfy the similarity criterion are written in parentheses, and their expression profiles are plotted with a dashed line.
Figure 3.
Figure 3.
The figure shows how the rules induced from all expression data sets distribute over the number of binding sites included in the rules. The results indicate that most often three binding sites are required to obtain coexpression.
Figure 4.
Figure 4.
Graph showing which binding-site pairs participate in the same binding-site modules as hypothesized by our rules. Nodes are the binding sites, and there is an edge between any two binding sites if they appear in the same rule (the number of rules including a particular binding site is given in brackets). Bold edges indicate that the two binding sites appear in a rule that was induced from more than one expression data set. The graph includes 41 of the 43 known binding sites. GAL and MET31-32 were not found in any rule. Corresponding graphs constructed using only significant rules according to each part of Gene Ontology and the binding data by Lee et al. (2002) may be found at http://www.lcb.uu.se/~vidsten/binding_sites/.

References

    1. Aach, J., Rindone, W., and Church, G.M. 2000. Systematic management and analysis of yeast gene expression data. Genome Res. 10: 431-445. - PubMed
    1. Ashburner, M., Ball, C.A., Blake, J.A., Botstein, D., Butler, H., Cherry, J.M., Davis, A.P., Dolinski, K., Dwight, S.S., Eppig, J.T., et al. 2000. Gene Ontology: Tool for the unification of biology. The Gene Ontology Consortium. Nat. Genet. 25: 25-29. - PMC - PubMed
    1. Beer, M.A. and Tavazoie, S. 2004. Predicting gene expression from sequence. Cell 117: 185-198. - PubMed
    1. Berman, B.P., Nibu, Y., Pfeiffer, B.D., Tomancak, P., Celniker, S.E., Levine, M., Rubin, G.M., and Eisen, M.B. 2002. Exploiting transcription factor binding site clustering to identify cis-regulatory modules involved in pattern formation in the Drosophila genome. Proc. Natl. Acad. Sci. 99: 757-762. - PMC - PubMed
    1. Brazma, A., Jonassen, I., Vilo, J., and Ukkonen, E. 1998. Predicting gene regulatory elements in silico on a genomic scale. Genome Res. 8: 1202-1215. - PMC - PubMed

WEB SITE REFERENCES

    1. http://salt2.med.harvard.edu/ExpressDB/; ExpressDB, database for gene expression data.
    1. http://genetics.med.harvard.edu/~tpilpel/MotComb.html; Web supplement to Pilpel et al. (2001).
    1. http://rosetta.lcb.uu.se; the ROSETTA system.
    1. http://www.geneontology.org; Gene Ontology.
    1. http://www.lcb.uu.se/~hvidsten/binding_sites/; our Web site with the Supplemental Material.

Publication types

Substances

LinkOut - more resources