

Identifying novel genes for atherosclerosis through mouse-human comparative genetics
- PMID: 15931593
- PMCID: PMC1226181
- DOI: 10.1086/431656
Identifying novel genes for atherosclerosis through mouse-human comparative genetics
Abstract
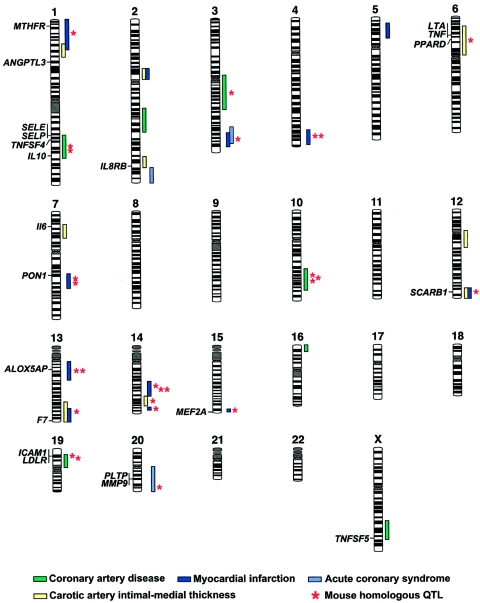
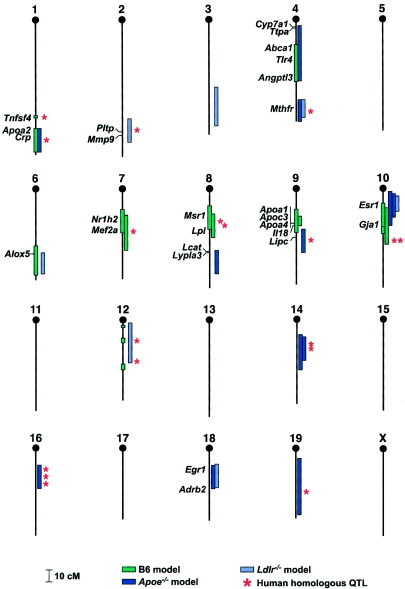
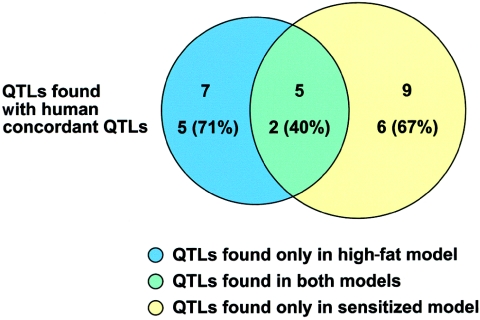
Susceptibility to atherosclerosis is determined by both environmental and genetic factors. Its genetic determinants have been studied by use of quantitative-trait-locus (QTL) analysis. So far, 21 atherosclerosis QTLs have been identified in the mouse: 7 in a high-fat-diet model only, 9 in a sensitized model (apolipoprotein E- or LDL [low-density lipoprotein] receptor-deficient mice) only, and 5 in both models, suggesting that different gene sets operate in each model and that a subset operates in both. Among the 27 human atherosclerosis QTLs reported, 17 (63%) are located in regions homologous (concordant) to mouse QTLs, suggesting that these mouse and human atherosclerosis QTLs have the same underlying genes. Therefore, genes regulating human atherosclerosis will be found most efficiently by first finding their orthologs in concordant mouse QTLs. Novel mouse QTL genes will be found most efficiently by using a combination of the following strategies: identifying QTLs in new crosses performed with previously unused parental strains; inducing mutations in large-scale, high-throughput mutagenesis screens; and using new genomic and bioinformatics tools. Once QTL genes are identified in mice, they can be tested in human association studies for their relevance in human atherosclerotic disease.
Figures
Similar articles
-
Genetics of variation in HDL cholesterol in humans and mice.Circ Res. 2005 Jan 7;96(1):27-42. doi: 10.1161/01.RES.0000151332.39871.13. Circ Res. 2005. PMID: 15637305 Review.
-
In search of new targets for plasma high-density lipoprotein cholesterol levels: promise of human-mouse comparative genomics.Trends Cardiovasc Med. 2006 Oct;16(7):220-34. doi: 10.1016/j.tcm.2006.04.003. Trends Cardiovasc Med. 2006. PMID: 16980179 Review.
-
In silico quantitative trait locus map for atherosclerosis susceptibility in apolipoprotein E-deficient mice.Arterioscler Thromb Vasc Biol. 2003 Jan 1;23(1):117-22. doi: 10.1161/01.atv.0000047461.18902.80. Arterioscler Thromb Vasc Biol. 2003. PMID: 12524234
-
QTL mapping for genetic determinants of lipoprotein cholesterol levels in combined crosses of inbred mouse strains.J Lipid Res. 2006 Aug;47(8):1780-90. doi: 10.1194/jlr.M500544-JLR200. Epub 2006 May 9. J Lipid Res. 2006. PMID: 16685081
-
Using advanced intercross lines for high-resolution mapping of HDL cholesterol quantitative trait loci.Genome Res. 2003 Jul;13(7):1654-64. doi: 10.1101/gr.1185803. Epub 2003 Jun 12. Genome Res. 2003. PMID: 12805272 Free PMC article.
Cited by
-
Genetic dissection of NK cell responses.Front Immunol. 2013 Jan 18;3:425. doi: 10.3389/fimmu.2012.00425. eCollection 2012. Front Immunol. 2013. PMID: 23346087 Free PMC article.
-
Leveraging an existing whole-genome resequencing population data set to characterize toll-like receptor gene diversity in a threatened bird.Mol Ecol Resour. 2022 Oct;22(7):2810-2825. doi: 10.1111/1755-0998.13656. Epub 2022 Jun 14. Mol Ecol Resour. 2022. PMID: 35635119 Free PMC article.
-
Combining genome-wide data from humans and animal models of dyslipidemia and atherosclerosis.Curr Opin Lipidol. 2011 Apr;22(2):100-5. doi: 10.1097/MOL.0b013e328342a375. Curr Opin Lipidol. 2011. PMID: 21178769 Free PMC article. Review.
-
Identification of genes and networks driving cardiovascular and metabolic phenotypes in a mouse F2 intercross.PLoS One. 2010 Dec 14;5(12):e14319. doi: 10.1371/journal.pone.0014319. PLoS One. 2010. PMID: 21179467 Free PMC article.
-
High-resolution genetic mapping in the diversity outbred mouse population identifies Apobec1 as a candidate gene for atherosclerosis.G3 (Bethesda). 2014 Oct 23;4(12):2353-63. doi: 10.1534/g3.114.014704. G3 (Bethesda). 2014. PMID: 25344410 Free PMC article.
References
Web Resources
-
- Center for Medical Genetics, http://research.marshfieldclinic.org/genetics/
-
- Ensembl Human Genome Browser, http://www.ensembl.org/Homo_sapiens/
-
- MGI Whole Genome Orthology Map, http://www.informatics.jax.org/reports/homologymap/mouse_human.shtml
-
- Online Mendelian Inheritance in Man (OMIM), http://www.ncbi.nlm.nih.gov/Omim/ (for ACE, ADRB2, ALOX5AP, APOE, F7, FGB, GP1BA, MMP3, MMP9, MTHFR, NOS3, PON1, TGFB1, THBS2, THBS4, TLR4, TNFSF4, MEF2A, POMC, CTLA4, and EN2)
References
-
- Ben-Asher E, Lancet D (2004) 5-Lipoxygenase activating protein (ALOX5AP): association with cardiovascular infarction and stroke. Isr Med Assoc J 6:318–319 - PubMed
Publication types
MeSH terms
Substances
Grants and funding
LinkOut - more resources
Full Text Sources
Molecular Biology Databases
