. 2005 Jun 2:6:82.
doi: 10.1186/1471-2164-6-82.

Large-scale genomic correlations in Arabidopsis thaliana relate to chromosomal structure

Affiliations

Large-scale genomic correlations in Arabidopsis thaliana relate to chromosomal structure

Wayne S Kendal et al. BMC Genomics. .

Abstract

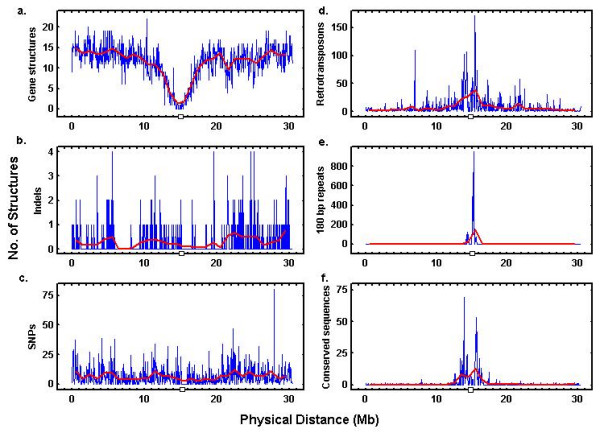
Background: The chromosomes of the plant Arabidopsis thaliana contain various genomic elements, distributed with appreciable spatial heterogeneity. Clustering of and/or correlations between these elements presumably should reflect underlying functional or structural factors. We studied the positional density fluctuations and correlations between genes, indels, single nucleotide polymorphisms (SNPs), retrotransposons, 180 bp tandem repeats, and conserved centromeric sequences (CCSs) in Arabidopsis in order to elucidate any patterns and possible responsible factors for their genomic distributions.

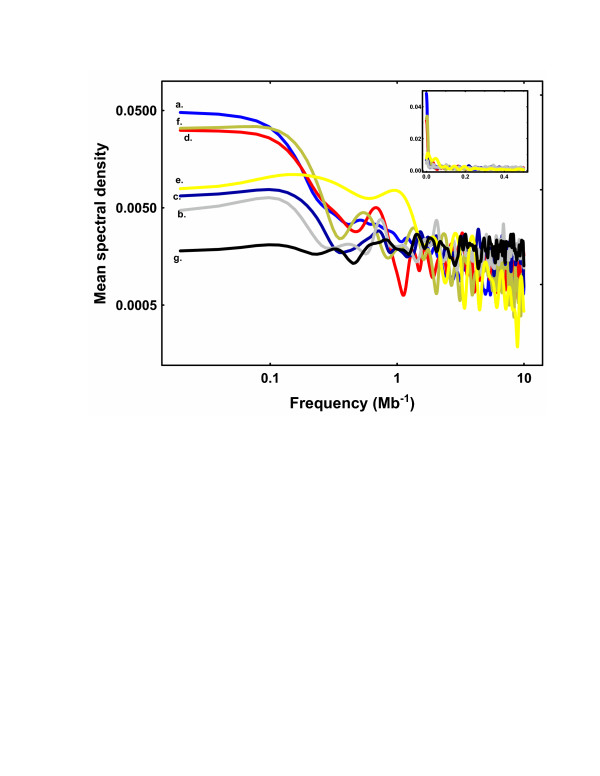
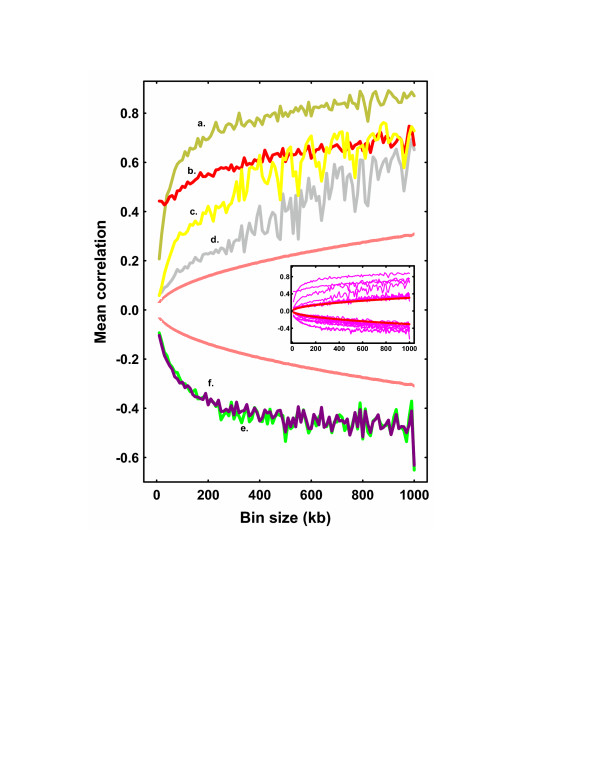
Results: The spatial distributions of all these elements obeyed a common pattern: the density profiles of each element within chromosomes exhibited low-frequency fluctuations indicative of regional clustering, and the individual density profiles tended to correlate with each other at large measurement scales. This pattern could be attributed to the influence of major chromosomal structures, such as centromeres. At smaller scales the correlations tended to weaken -- evidence that localized cis-interactions between the different elements had a comparatively minor, if any, influence on their placement.

Conclusion: The conventional notion that retrotransposon insertion sites are strongly influenced by cis-interactions was not supported by these observations. Moreover, we would propose that large-scale chromosomal structure has a dominant influence on the intrachromosomal distributions of genomic elements, and provides for an additional shared hierarchy of genomic organization within Arabidopsis.


Figures

Figure 1
Figure 1
Density profiles for genomic elements along the length of Arabidopsis chromosome 1. Local densities were estimated based upon 50 kb (blue lines) and 1 Mb (red lines) enumerative bins and the density profiles were plotted as the number of structures per 50 kb length of chromosome vs. physical distance as measured from the p-terminal of the chromosome. (a) Genes. (b) Indels. (c) SNPs. (d) Retrotransposons. (e) 180 bp repeats. (f) CCSs. The centromeric region was located at about 15 Mb from the p-terminus. The discontinuity indicated along each X-axis is indicative of the gap in the physical map at this region. Although the lines and axes are drawn continuously in these graphs we must remember that there remains large gaps within the centromeric regions of each chromosome which have not been completely defined.
Figure 2
Figure 2
Power spectra for the fluctuations in positional density from genomic elements in Arabidopsis chromosomes. Mean spectral densities for the fluctuations of each element within individual chromosomes were calculated, normalized, averaged over all 5 Arabidopsis chromosomes, and then plotted vs. frequency. The power spectra for all 6 genomic elements were qualitatively similar on this log-log plot: the most intense fluctuations were located at the low-frequency ends of the spectra. (a) Genes. (b) Indels. (c) SNPs. (d) Retrotransposons. (e) 180 bp repeats. (f) CCSs. (g) Simulated data from a Poisson distribution. (Insert) Mean Spectral Densities plotted with linear scales to emphasize the concentration of density fluctuations at low frequency.
Figure 3
Figure 3
Mean correlation coefficient vs. measurement bin size. The quadratic mean of r, from all 5 Arabidopsis chromosomes, was plotted vs. a range of measurement bin sizes. The correlations provided here represent the 10 of the stronger relationships: (a) Retrotransposons vs. CCSs. (b) Indels vs. SNPs. (c) Retrotransposons vs. 180 bp repeats. (d) 180 bp repeats vs. CCSs. (e) Genes vs. retrotransposons (f) Genes vs. CCSs. The broken red lines represents the critical values corresponding to P = 0.05 and obtained by simulation. (Insert) Mean correlation vs. measurement bin size for the envelope of all 15 comparisons. Here the solid red lines represent the critical values corresponding to P = 0.05.

Similar articles

Cited by

References

    1. Copenhaver GP, Nickel K, Kuromori T, Benito M-I, Kaul S, Lin X, Bevan M, Murphy G, Harris B, Parnell LD, et al. Genetic definition and sequence analysis of Arabidopsis centromeres. Science. 1999;286:2468–2474. doi: 10.1126/science.286.5449.2468. - DOI - PubMed
    1. Hall AE, Keith KC, Hall SE, Copenhaver GP, Preuss D. The rapidly evolving field of plant centromeres. Curr Opin Plant Biol. 2004;7:108–114. doi: 10.1016/j.pbi.2004.01.008. - DOI - PubMed
    1. Sachidanandam R, Weissman D, Schmidt SC, Kakol JM, Stein LD, Marth G, Sherry S, Mullikin JC, Mortimore BJ, Willey DL, et al. A map of human genome sequence variation containing 1.42 million single nucleotide polymorphisms. Nature. 2001;409:928–933. doi: 10.1038/35057149. - DOI - PubMed
    1. Kendal WS. An exponential dispersion model for the distribution of human single nucleotide polymorphisms. Mol Biol Evol. 2003;20:579–590. doi: 10.1093/molbev/msg057. - DOI - PubMed
    1. Kendal WS. A scale invariant clustering of genes on human chromosome 7. BMC Evol Biol. 2004;4:3. doi: 10.1186/1471-2148-4-3. - DOI - PMC - PubMed

LinkOut - more resources