. 2005 Aug 1;566(Pt 3):807-19.
doi: 10.1113/jphysiol.2005.089581. Epub 2005 Jun 2.

Midline serotonergic neurones contribute to widespread synchronized activity in embryonic mouse hindbrain

Affiliations

Midline serotonergic neurones contribute to widespread synchronized activity in embryonic mouse hindbrain

Peter N Hunt et al. J Physiol. .

Abstract

Spontaneous, synchronous activity occurs in motor neurones of the embryonic mouse hindbrain at the stage when rhombomeric segmentation disappears (embryonic day 11.5). The mechanisms generating and synchronizing the activity, however, and the extent to which it is widespread in the hindbrain, are unknown. We show here that spontaneous activity is initiated in the midline of the hindbrain, and propagates laterally to encompass virtually the entire hindbrain synchronously and bilaterally. Separation of the midline region from lateral regions abolishes or slows activity laterally, but not medially. The early differentiating neurones of the midline raphe system are present in the rostral midline and express serotonin at E11.5. Their axons ramify extensively in the marginal zone, cross the midline, and extend at the midline both rostrally into the midbrain and caudally towards the caudal hindbrain. Blockers of serotonin receptors, specifically the 5-HT(2A) receptor, abolish synchronous activity in the hindbrain, while blockers of other neurotransmitter systems, including GABA and glutamate, do not. In addition, the 5-HT(2A) receptor is expressed in the marginal regions in the entire medial-to-lateral extent of the hindbrain and in the midline commissural region. Thus, the serotonergic neurones of the developing midline raphe system may play a role in initiating and propagating spontaneous synchronous activity throughout the hindbrain.


Figures

Figure 1
Figure 1. A sequential series of [Ca2+]i imaging experiments in identified regions of one half of a hindbrain shows that synchronization of [Ca2+]i signals is found in each region of the hindbrain
A, the central portion of the figure shows anatomical landmarks identified by dextran labelling of branchiomeric motor neurones, taken at a wavelength of 594 nm. The midline is indicated by the vertical line to the right; positions of the former rhombomere borders are indicated with horizontal bars on the midline; arrows at top of figure indicate the rostral–caudal and medial–lateral axes of the tissue. Trigeminal motor neurones are seen in the upper left of the montage (nV) near their axonal exit point (EP-V, *); somata for the facial motor neurones (nVII) are near the midline with their axons fanning laterally toward the VII exit point (EP-VII, *). The outlined rectangle shows one of the eight imaging fields in this experiment. Three small squares (i, ii, iii) are example sites yielding the resultant [Ca2+]i traces in the plot immediately to the right of this field within the montage, and are a portion of the recordings resulting from the larger array that covers the entire field (other sites of the array not shown). Insets: [Ca2+]i signals were recorded from overlapping fields, and examples of activity in each field displayed in the adjacent inset as a 2-min segment of activity obtained from recording sites arrayed on the rectangular field. Vertical scale bars indicate 1 unit of change in fluorescence. B, schematic diagram depicting the montage of the fields of the hindbrain in part A, and the anatomical landmarks illustrated by retrograde dextran labelling. C, the same rectangular field outlined in part A, taken at 488 nm to show the fluo-4 loading of the tissue. Cells at the midline are individually loaded, and the axons from the nVII fan can be seen. D, image from a different experiment on the field of the r5-midline area, taken at 488 nm to show the axon fibres in the marginal zone of the hindbrain.
Figure 2
Figure 2. Propagation of [Ca2+]i signals from midline to lateral regions in the ‘open hindbrain’ preparation
Both sets of traces are taken from experiments where a field of approximately 895 μm × 700 μm was sampled with an array of recording sites. A, records from medial to lateral regions were stacked vertically to show the wave of activity propagating away from the midline (midline at bottom; region at top is 478 μm lateral to that at bottom). Events that did not propagate from the midline are indicated by open circles. Scale bars are 1 unit of change in fluorescence and 20 s. B, expanded records sampled at 0.4 s from a different experiment. Grey dots are at the initial upstroke of [Ca2+]i transients taken from regions separated by 662 μm. Scale bars are 2 units of change in fluorescence and 2 s.
Figure 3
Figure 3. Midline tissue drives laterally propagating activity
A, [Ca2+]i transients in 4-min segments of recording from medial (lower record, from site 1) and lateral (upper record, from site 2) areas from an intact hindbrain. Recording regions are shown as grey boxes in the drawing in part C, with site 1 being the medial recording position, site 2 being the lateral recording position. Open circles mark events that did not propagate into the lateral tissue. Scale bars are 1 unit of change in fluorescence for both A and B. B, same regions after complete vertical transection of the hindbrain at the dashed line shown in part C. C, drawing of hindbrain indicating the recording configuration and the relative position of the cut through the tissue. D, bar graph showing collated results of separation experiments (n =18); the frequency of lateral events is lower initially (M-pre compared to L-pre, *P = 0.01), and decreases significantly after connections from the medial regions are cut (L-pre compared to L-post, **P = 0.00065). Frequency of medial regions is unaffected by separation from lateral tissues (M-pre compared to M-post, P = 0.3).
Figure 4
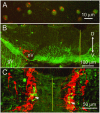
Figure 4. Serotonin is expressed in the hindbrain midline of the E11.5 embryo, shown in immunocytochemical labelling of 20 μm cryostat sections
Arrows in A and C indicate axes of the animal. A and B, parasagittal sections showing the developing rostral raphe group. A is a section 20 μm lateral to the midline of the animal, and shows the rostral–caudal extent of axonal processes; the arrowhead marks the isthmus (midbrain–hindbrain junction), and serotonergic processes can be seen to extend past the isthmus into the midbrain. B is 40 μm more lateral, and shows the group of cell bodies covering approximately 680 μm in the rostral hindbrain; immunopositive somata are not seen outside of the hindbrain. C is a horizontal section showing serotonin-immunopositive neurones immediately adjacent to the midline with axons ramifying extensively in the marginal zone, and extending across the midline. Section is positioned with ventricular zone towards the top of the picture.
Figure 5
Figure 5. The 5-HT2A receptor is expressed in regions appropriate for mediating propagation of activity
A, fluo-4-loaded dextran-injected motor neurones during [Ca2+]i imaging experiment. B, horizontal 20 μm cryostat section demonstrating immunoreactivity for the 5-HT2A receptor. Strong staining is observed in the midline commissural area (vertical line indicates midline), and in the marginal zone lateral to the midline. This animal was dextran-injected in the b1 branchial arch, and motor neurones can be seen in the V motor group (nV) in red. Strong receptor immunoreactivity is also observed in the sensory axons of the Vth sensory ganglion (gV). Arrows at right of figure show the dorsal and ventral axes, and apply to part C as well. C, co-immunolabelling for serotonin reactivity (red) and 5-HT2A receptor (green). Receptor immunoreactivity is strong in processes crossing the midline, in a few serotonin-immunolabelled neurones immediately lateral to the midline (arrowheads), and in the marginal zone extending laterally. Vertical bar indicates midline.
Figure 6
Figure 6. Pharmacological manipulation of spontaneous activity in hindbrain
A, 1 μm ketanserin has little effect on spontaneous activity. B, 10 μm ketanserin completely blocks spontaneous activity, which returns upon washout of the drug. Gap in time axis is 40 min. C, 10 nm spiperone slightly reduces the frequency of spontaneous activity. D, 20 nm spiperone completely blocks spontaneous activity, which returns upon washout of the drug. Gap in time axis is 15 min. Vertical scale bars are 3 units of change in fluorescence for panels A, B and D, 2 units of change in fluorescence for panel C; horizontal scale bars are 5 min for all panels.
Figure 7
Figure 7. Serotonergic neurones are the majority of neurones in the midline region
The same section is shown labelled for serotonin (A, green), TuJ1 (B, red), and the merged image (C) of serotonin, TuJ1 and DAPI (blue). The scale bar of 125 μm applies to all three images; as do the arrows indicating axes. Both sides of the hindbrain are shown, with the ventricular zone positioned towards the top of the picture.
Figure 8
Figure 8. Medial-to-lateral activity is contained within a single 200 μm horizontal slices
A, a horizontal section of a E11.5 embryo loaded with fluo-4 during a [Ca2+]i imaging experiment. The midline is shown by the vertical line, and the cell-free marginal zone (MZ) and proliferative ventricular zone (VZ) are indicated with brackets. Arrows indicate the dorsal and ventral axes of the tissue. Recording regions span the tissue from the midline to the more lateral regions (open circles) in both the MZ and VZ, and on the contralateral side. Activity recorded from these regions is shown in panel C. Boxed region shows the area of the slice that is shown in part B. B, central region of the fluo-4-loaded slice from A (green), overlaid with the images from the same slice after one hour fixation with 4% PFA and immunocytochemistry for serotonin (red). Neurones with extensive processes are seen on both sides of the midline (vertical line). Scale bar is 100 μm, the same as part A. C, records of activity from recording areas in the marginal zone (MZ), the ventricular zone (VZ) or the contralateral side (con). Scale bars are 3 units of fluorescence change and 10 s. Arrow indicates medial to lateral position of recording sites both in the marginal zone and ventricular zone traces.

Comment in

Similar articles

Cited by

References

    1. Barnes NM, Sharp T. A review of central 5-HT receptors and their function. Neuropharmacology. 1999;38:1083–1152. - PubMed
    1. Ben-Ari Y. Excitatory actions of GABA during development: the nature of the nurture. Nature Rev Neurosci. 2002;3:728–739. - PubMed
    1. Ben-Ari Y, Cherubini E, Corradetti R, Gaiarsa JL. Giant synaptic potentials in immature rat CA3 hippocampall neurones. J Physiol. 1989;416:303–325. - PMC - PubMed
    1. Betancur C, Corbex M, Spielewoy C, Philippe A, Laplanch JL, Launay JM, Gillberg C, Mouren-Simeoni MC, Hamon M, Giros B, Nosten-Bertrand M, Leboyer M. Serotonin transporter gene polymorphisms and hyperserotonemia in autistic disorder. Mol Psychiatry. 2002;7:67–71. - PMC - PubMed
    1. Bruning G, Liangos O, Baumgarten HG. Prenatal development of the serotonin transporter in mouse brain. Cell Tissue Res. 1997;289:211–221. - PubMed

Publication types

LinkOut - more resources