

Inactivation of enteric adenovirus and feline calicivirus by chlorine dioxide
- PMID: 15933007
- PMCID: PMC1151811
- DOI: 10.1128/AEM.71.6.3100-3105.2005
Inactivation of enteric adenovirus and feline calicivirus by chlorine dioxide
Abstract
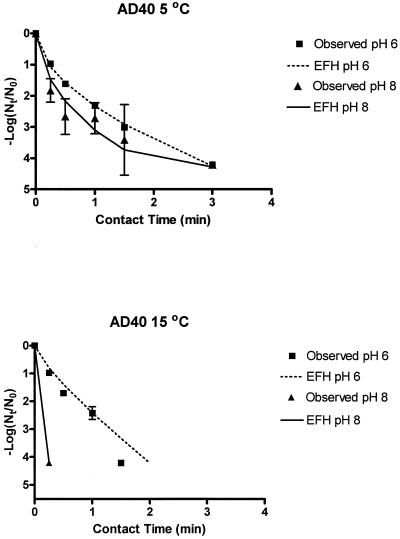
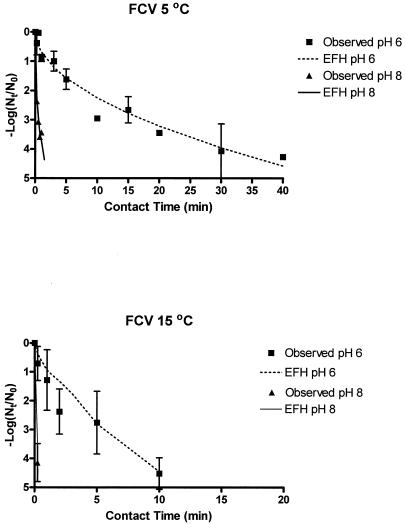
Chlorine dioxide (ClO2) inactivation experiments were conducted with adenovirus type 40 (AD40) and feline calicivirus (FCV). Experiments were carried out in buffered, disinfectant demand-free water under high- and low-pH and -temperature conditions. Ct values (the concentration of ClO2 multiplied by contact time with the virus) were calculated directly from bench-scale experiments and from application of the efficiency factor Hom (EFH) model. AD40 Ct ranges for 4-log inactivation (Ct99.99%) at 5 degrees C were >0.77 to <1.53 mg/liter x min and >0.80 to <1.59 mg/liter x min for pH 6 and 8, respectively. For 15 degrees C AD40 experiments, >0.49 to <0.74 mg/liter x min and <0.12 mg/liter x min Ct99.99% ranges were observed for pH 6 and 8, respectively. FCV Ct99.99% ranges for 5 degrees C experiments were >20.20 to <30.30 mg/liter x min and >0.68 mg/liter x min for pH 6 and 8, respectively. For 15 degrees C FCV experiments, Ct99.99% ranges were >4.20 to <6.72 and <0.18 mg/liter x min for pH 6 and 8, respectively. Viral inactivation was higher at pH 8 than at pH 6 and at 15 degrees C than at 5 degrees C. Comparison of Ct values and inactivation curves demonstrated that the EFH model described bench-scale experiment data very well. Observed bench-scale Ct99.99% ranges and EFH model Ct99.99% values demonstrated that FCV is more resistant to ClO2 than AD40 for the conditions studied. U.S. Environmental Protection Agency guidance manual Ct99.99% values are higher than Ct99.99% values calculated from bench-scale experiments and from EFH model application.
Figures
References
-
- Aieta, E. M., and J. D. Berg. 1986. A review of chlorine dioxide in drinking water treatment. J. Am. Water Works Assoc. June:62-72.
-
- American Public Health Association. 1998. Standard methods for the examination of water and wastewater, 20th ed. American Public Health Association, Washington, D.C.
-
- American Water Works Association. 1995. Water treatment: principles and practices of water supply operations, 2nd ed. American Water Works Association, Denver, Colo.
Publication types
MeSH terms
Substances
LinkOut - more resources
Full Text Sources
Other Literature Sources
Medical
