. 2005 Jun 2;33(10):3154-64.
doi: 10.1093/nar/gki624. Print 2005.

oPOSSUM: identification of over-represented transcription factor binding sites in co-expressed genes

Affiliations

oPOSSUM: identification of over-represented transcription factor binding sites in co-expressed genes

Shannan J Ho Sui et al. Nucleic Acids Res. .

Abstract

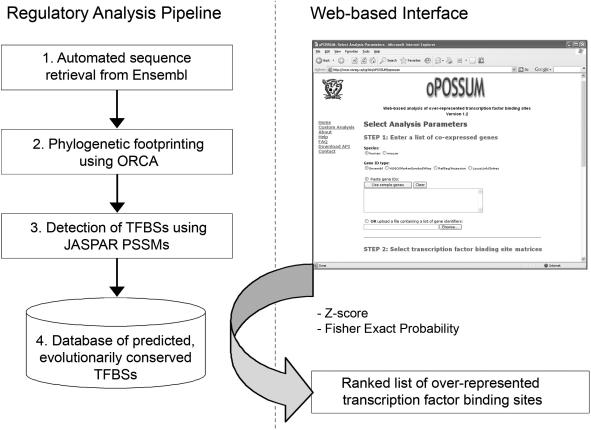
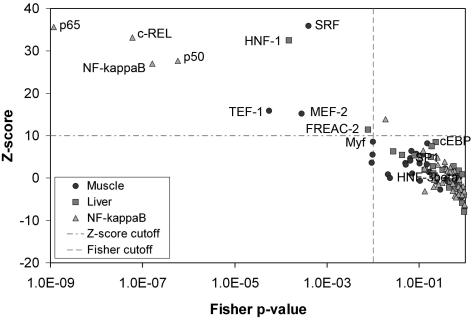
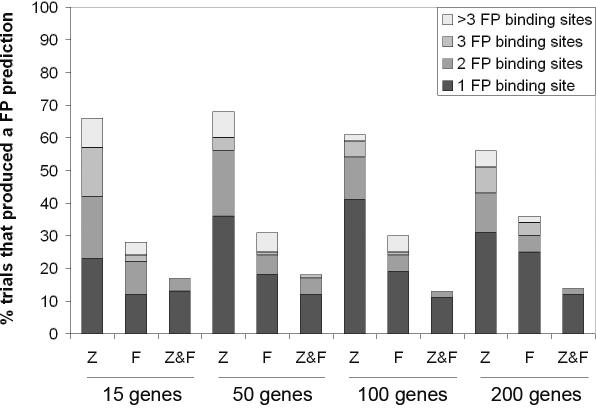
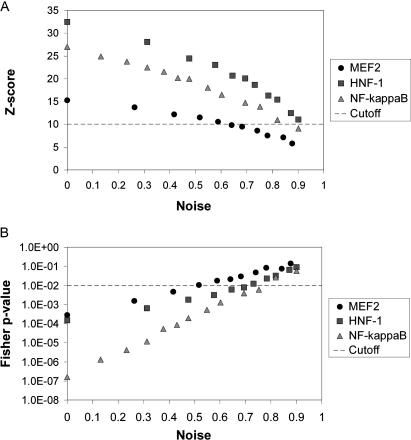
Targeted transcript profiling studies can identify sets of co-expressed genes; however, identification of the underlying functional mechanism(s) is a significant challenge. Established methods for the analysis of gene annotations, particularly those based on the Gene Ontology, can identify functional linkages between genes. Similar methods for the identification of over-represented transcription factor binding sites (TFBSs) have been successful in yeast, but extension to human genomics has largely proved ineffective. Creation of a system for the efficient identification of common regulatory mechanisms in a subset of co-expressed human genes promises to break a roadblock in functional genomics research. We have developed an integrated system that searches for evidence of co-regulation by one or more transcription factors (TFs). oPOSSUM combines a pre-computed database of conserved TFBSs in human and mouse promoters with statistical methods for identification of sites over-represented in a set of co-expressed genes. The algorithm successfully identified mediating TFs in control sets of tissue-specific genes and in sets of co-expressed genes from three transcript profiling studies. Simulation studies indicate that oPOSSUM produces few false positives using empirically defined thresholds and can tolerate up to 50% noise in a set of co-expressed genes.


Figures

Figure 1
Figure 1
The oPOSSUM system for identifying over-represented TFBSs in sets of co-expressed genes. The system is built upon a database of conserved TFBSs for human–mouse orthologs, derived from an analysis pipeline that combines phylogenetic footprinting with TFBS identification using the JASPAR library of PSSMs. Given a set of human or mouse genes, the pipeline (1) retrieves the genomic DNA sequence for the human and mouse genes plus 5000 bp of upstream sequence, (2) performs an alignment of the orthologous sequences and extracts non-coding DNA subsequences that are conserved above a predefined threshold, (3) searches the subsequences for matches to TFBS profiles contained in JASPAR and (4) stores the results in the oPOSSUM database. Upon querying the web-based interface with a list of co-expressed genes, oPOSSUM retrieves the TFBS counts for each gene in the list and computes two statistics (Z-score, Fisher exact test) to measure over-representation of TFBSs in the set relative to a background comprising all genes in the oPOSSUM database.
Figure 2
Figure 2
Relationship between the Fisher P-values and Z-scores for the muscle, liver and NF-κB reference sets. Based on the distribution of scores for the reference sets, a Z-score cutoff of 10 and a Fisher P-value cutoff of 0.01 were empirically selected as threshold levels to be used for testing. TFBSs that have functional relevance are labeled.
Figure 3
Figure 3
Percentage of trials that produced false positive (FP) predictions. Sets containing 15, 50, 100 and 200 randomly selected genes were generated and submitted to oPOSSUM (100 trials each). Each segment of the bar represents the percentage of trials where n TFBSs were over-represented by chance using the Z-score and Fisher P-value cutoffs. Symbols: Z = Z-score > 10; F = Fisher < 0.01; Z&F = Z-score > 10 and Fisher < 0.01.
Figure 4
Figure 4
Noise tolerance. Increasing numbers of randomly selected genes were added to the muscle, liver and NF-κB reference sets to assess the effect of noise on (A) the Z-score and (B) Fisher exact probability statistical measures. The amount of noise is represented as the fraction of all genes in the set that were randomly selected. Average Z-scores and Fisher P-values for MEF2, HNF-1 and NF-κB over 100 trials for each noise level are shown to represent the muscle, liver and NF-κB reference sets, respectively. Suggested cutoffs for the Z-score and Fisher P-value are shown by the dotted grey lines.
Figure 5
Figure 5
The oPOSSUM result report for the identification of over-represented TFBSs in sets of co-expressed genes. (A) Results report showing the selected parameters, genes included and excluded in the analysis, and summary tables containing the Fisher exact probability scores and Z-scores for each TFBS (only the first five results are shown for each statistical test in this figure). (B) Pop-up window displaying genes that contain a particular TFBS (in this case, MEF2), as well as the site locations and scores.

References

    1. Stormo G.D. DNA binding sites: representation and discovery. Bioinformatics. 2000;16:16–23. - PubMed
    1. Pollock R., Treisman R. A sensitive method for the determination of protein–DNA binding specificities. Nucleic Acids Res. 1990;18:6197–6204. - PMC - PubMed
    1. Bulyk M.L., Gentalen E., Lockhart D.J., Church G.M. Quantifying DNA–protein interactions by double-stranded DNA arrays. Nat. Biotechnol. 1999;17:573–577. - PubMed
    1. Wingender E., Dietze P., Karas H., Knuppel R. TRANSFAC: a database on transcription factors and their DNA binding sites. Nucleic Acids Res. 1996;24:238–241. - PMC - PubMed
    1. Sandelin A., Alkema W., Engstrom P., Wasserman W.W., Lenhard B. JASPAR: an open-access database for eukaryotic transcription factor binding profiles. Nucleic Acids Res. 2004;32:D91–D94. - PMC - PubMed

Publication types

Grants and funding