Review
. 2005 Mar-Apr;22(2):187-201.
doi: 10.1017/S0952523805222071.

Functional and cortical adaptations to central vision loss

Affiliations
Review

Functional and cortical adaptations to central vision loss

Sing-Hang Cheung et al. Vis Neurosci. 2005 Mar-Apr.

Abstract

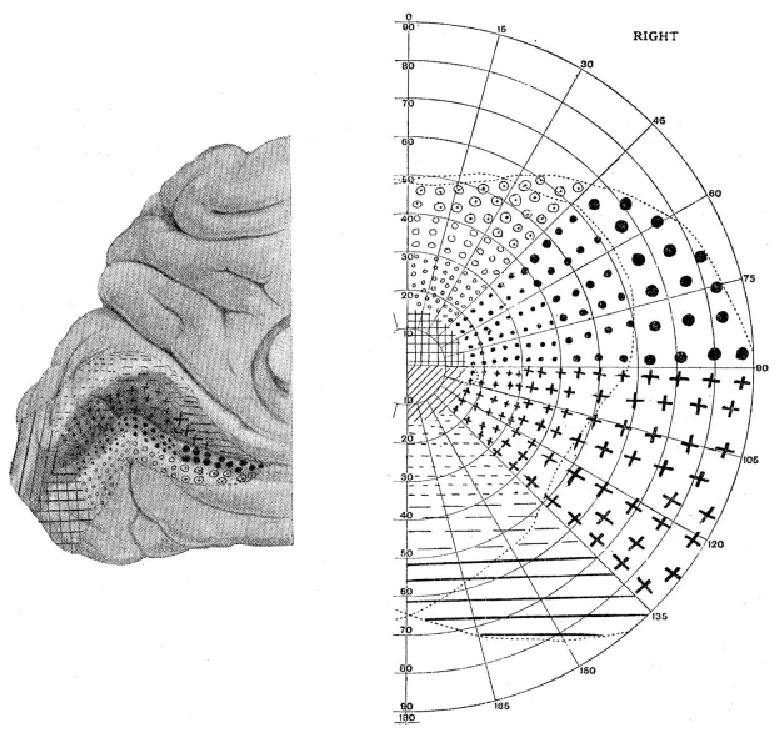
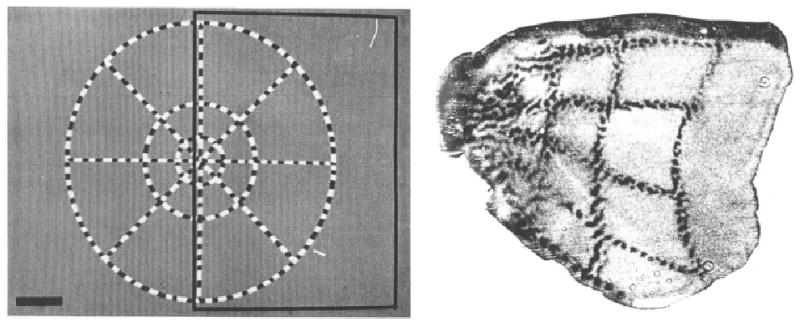
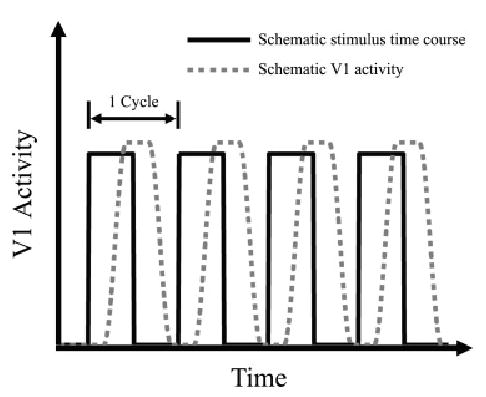
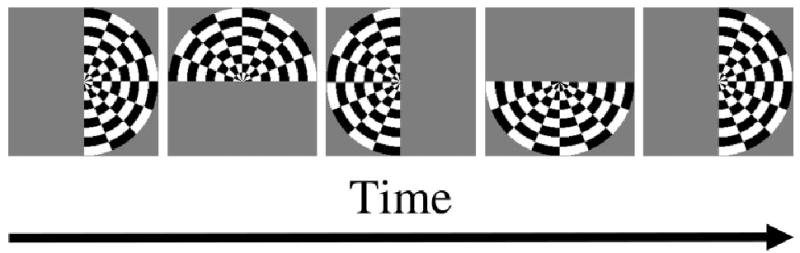
Age-related macular degeneration (AMD), affecting the retina, afflicts one out of ten people aged 80 years or older in the United States. AMD often results in vision loss to the central 15-20 deg of the visual field (i.e. central scotoma), and frequently afflicts both eyes. In most cases, when the central scotoma includes the fovea, patients will adopt an eccentric preferred retinal locus (PRL) for fixation. The onset of a central scotoma results in the absence of retinal inputs to corresponding regions of retinotopically mapped visual cortex. Animal studies have shown evidence for reorganization in adult mammals for such cortical areas following experimentally induced central scotomata. However, it is still unknown whether reorganization occurs in primary visual cortex (V1) of AMD patients. Nor is it known whether the adoption of a PRL corresponds to changes to the retinotopic mapping of V1. Two recent advances hold out the promise for addressing these issues and for contributing to the rehabilitation of AMD patients: improved methods for assessing visual function across the fields of AMD patients using the scanning laser ophthalmoscope, and the advent of brain-imaging methods for studying retinotopic mapping in humans. For the most part, specialists in these two areas come from different disciplines and communities, with few opportunities to interact. The purpose of this review is to summarize key findings on both the clinical and neuroscience issues related to questions about visual adaptation in AMD patients.


Figures

Fig. 1
Fig. 1
Holmes’s (1918/1945) retinotopic map of the visual cortex. Different locations of the right visual field (right panel) and the corresponding cortical representation in the left hemisphere (medial view, left panel) are marked by different symbols. (Reproduced by permission from Holmes G. “The organization of the visual cortex in man” in the Proceedings of the Royal Society B (London) 132 (869) (April 10, 1945), p. 352 (Fig. 5); © 1945 by the Royal Society).
Fig. 2
Fig. 2
Retinotopic map of visual cortex in a macaque monkey. Left panel shows the visual stimulus with check-filled radial lines and concentric rings. Right panel shows the flattened visual cortex with representation of the radial lines and concentric rings marked by 2-DG. (Reproduced by permission from Tootell R.B.H., Switkes E., Silverman M.S. & Hamilton S.L. “Functional anatomy of macaque striate cortex. II. Retinotopic organization” in the Journal of Neuroscience 8(5), p. 1534 (Fig. 1) and p. 1535 (Fig. 2B); © 1988 by the Society for Neuroscience)
Fig. 3
Fig. 3
Plots of cortical magnification factor (M) vs. eccentricity. The gray curves are estimated functions from Tootell et al.’s (1988) 2-DG study on monkeys. The corresponding equations are: horizontal meridian (dashed line) M = (0.108 + 0.066 * E)−1, and vertical meridian (solid line) M = (0.070 + 0.052 * E)−1. The black curves are estimated functions from Sereno et al.’s (1995) human fMRI study: M = 20.05 * (0.08 + E)−1.26, and Duncan and Boynton’s (2003) human fMRI study: M = (0.054 + 0.065 * E)−1.
Fig. 4
Fig. 4
The expanding-annulus stimulus. The annulus expands until the outer annulus reaches the boundary of the display (third panel) and then starts from the center again (fourth and fifth panels). A complete cycle is shown in panels 1–4. The fifth panel shows the beginning of the next cycle. The annulus is filled with flickering checks to optimize V1 response.
Fig. 5
Fig. 5
Schematic V1 activity in response to periodic retinal stimulation. The black curve represents the periodic retinal stimulation. The gray dashed curve represents the corresponding schematic V1 activity. Four cycles of activity are depicted.
Fig. 6
Fig. 6
Rotating-half-circle stimulus. The half circle rotates about the fixation point periodically. The first and fifth panels represent the beginning of the first and second cycle. The half circle is filled with flickering checks to optimize V1 response.

Similar articles

Cited by

References

    1. Adams DL, Horton JC. Shadows cast by retinal blood vessels mapped in primary visual cortex. Science. 2002;298:572–576. - PMC - PubMed
    1. Adams DL, Horton JC. A precise retinotopic map of primate striate cortex generated from the representation of angioscotomas. Journal of Neuroscience. 2003;23:3771–3789. - PMC - PubMed
    1. Akutsu H, Legge GE, Ross JA, Schuebel K. Psychophysics of reading. X. Effects of age-related changes in vision. Journal of Gerontology: Psychological Sciences. 1991;46:325–331. - PubMed
    1. Altpeter E, Mackeben M, Trauzettel-Klosinski S. The importance of sustained attention for patients with maculopathies. Vision Research. 2000;40:1539–1547. - PubMed
    1. Ambati J, Ambati BK, Yoo SH, anchulev S, Adamis AP. Age-related macular degeneration: Etiology, pathogenesis, and therapeutic strategies. Survey of Ophthalmology. 2003;48:257–293. - PubMed

Publication types