Review
. 2005 Apr 29;360(1456):665-91.
doi: 10.1098/rstb.2005.1626.

Brain maps, great and small: lessons from comparative studies of primate visual cortical organization

Affiliations
Review

Brain maps, great and small: lessons from comparative studies of primate visual cortical organization

Marcello G P Rosa et al. Philos Trans R Soc Lond B Biol Sci. .

Abstract

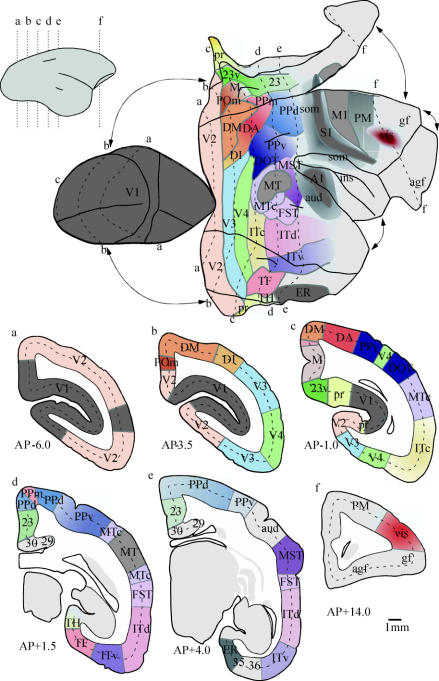
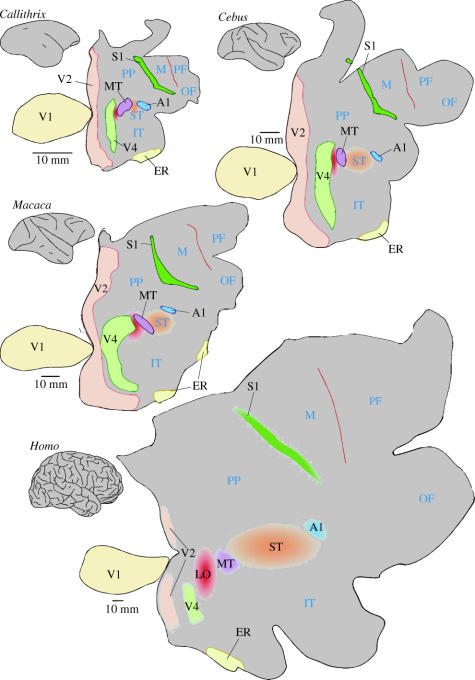
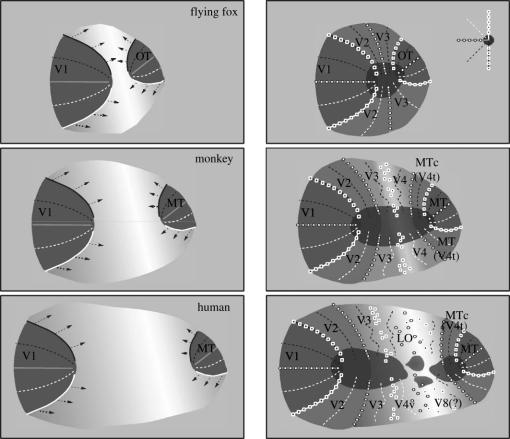
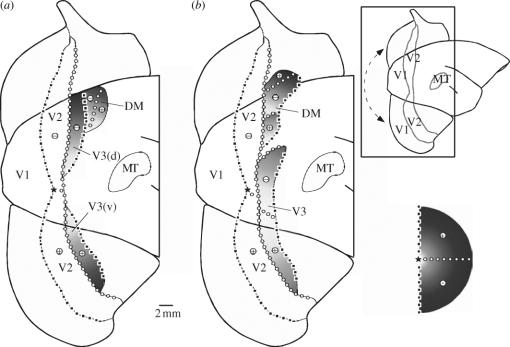
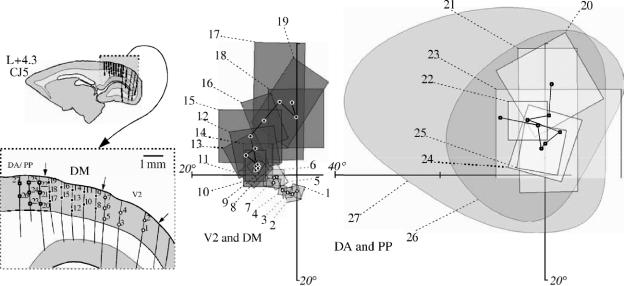
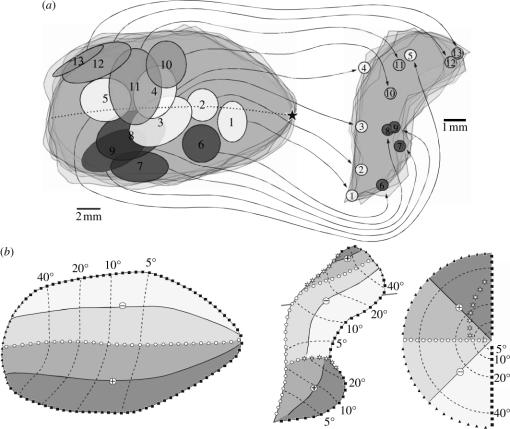
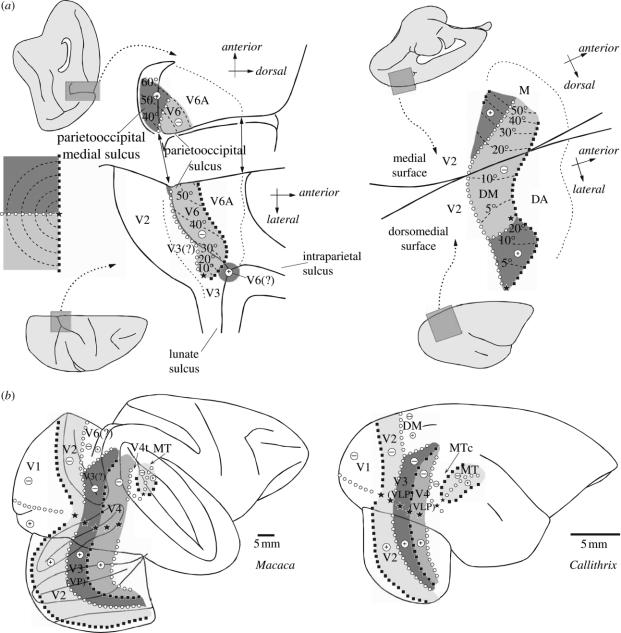
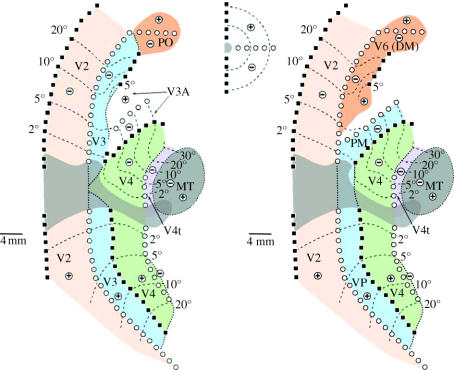
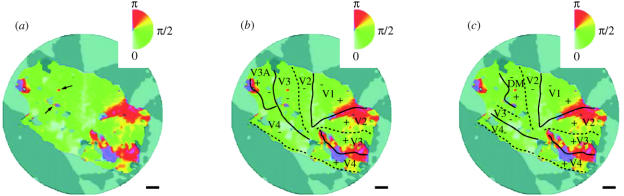
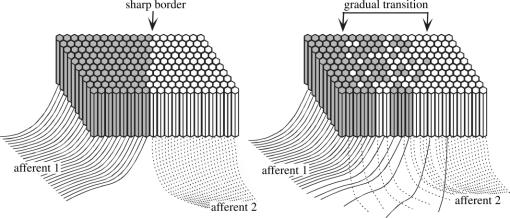
In this paper, we review evidence from comparative studies of primate cortical organization, highlighting recent findings and hypotheses that may help us to understand the rules governing evolutionary changes of the cortical map and the process of formation of areas during development. We argue that clear unequivocal views of cortical areas and their homologies are more likely to emerge for "core" fields, including the primary sensory areas, which are specified early in development by precise molecular identification steps. In primates, the middle temporal area is probably one of these primordial cortical fields. Areas that form at progressively later stages of development correspond to progressively more recent evolutionary events, their development being less firmly anchored in molecular specification. The certainty with which areal boundaries can be delimited, and likely homologies can be assigned, becomes increasingly blurred in parallel with this evolutionary/developmental sequence. For example, while current concepts for the definition of cortical areas have been vindicated in allowing a clarification of the organization of the New World monkey "third tier" visual cortex (the third and dorsomedial areas, V3 and DM), our analyses suggest that more flexible mapping criteria may be needed to unravel the organization of higher-order visual association and polysensory areas.


Figures

Figure 1
Figure 1
(Opposite.) Organization of the cerebral cortex in the marmoset, one of the smallest simian primates. Top: graphical reconstruction of the cerebral cortex of the right hemisphere, created from coronal sections stained for myelin. Thick lines indicate major folds (e.g. the boundary between the cortex exposed on the lateral surface of the brain and that buried along the midline fissure, and the lips of the calcarine and lateral sulci). To minimize distortions, discontinuities were introduced at several points along the perimeter (as indicated by the arrows). The presently recognized visual areas, and territories associated with other modalities, are shown in different colours. The contours corresponding to six anteroposterior levels are indicated by dashed lines. Bottom: the corresponding coronal sections, with areal borders indicated in colour. The names of the areas and their sources are listed below, from posterior to anterior in the brain. Other abbreviations: agf, agranular frontal cortex; gf, granular frontal cortex; ins, insular cortex. V1—primary visual area (Fritsches & Rosa 1996). V2—second visual area (Rosa et al. 1997b). DM—dorsomedial area (Rosa et al. 2004). V3—third visual area: corresponds to the ‘ventrolateral posterior area’ defined in marmosets (Rosa & Tweedale 2000). DA (dorsoanterior), DI (dorsointermediate) and PPm (posterior parietal medial) areas—putative functional subdivisions of a densely myelinated architectural field located rostral to DM (Rosa & Schmid 1995). M (medial) and POm (parietooccipital medial) areas—putative functional subdivisions of a more lightly myelinated architectural field located medial to DM (Rosa & Schmid 1995). 23 and 23v—subdivisions of area 23, defined by cytoarchitectural criteria (Kobayashi & Amaral 2000); subdivision 23v is more directly related to visual function (Kobayashi & Amaral 2003). Pr—prostriate area; a visually responsive subdivision of retrosplenial cortex (Rosa et al. 1997a,b). V4—fourth visual area: corresponds to the ‘ventrolateral anterior area’ defined in marmosets (Rosa & Tweedale 2000). TF—visually responsive cytoarchitectural field of the parahippocampal cortex, which may include more than one functional subdivision; bordered medially by field TH (Suzuki & Amaral 2003). ITc—caudal subdivision of the inferior temporal cortex (Rosa & Tweedale 2000). MT—middle temporal area. Surrounded by the middle temporal crescent (MTc; Rosa & Elston 1998). DOT—dorsal occipitotemporal area (Rosa & Tweedale 2000). PPd and PPv—architecturally defined dorsal and ventral subdivisions of the posterior parietal cortex. FST—fundus of superior temporal area (Rosa & Elston 1998). ITd and ITv—major architectural subdivisions of the inferior temporal area; correspond roughly to Brodmann's areas 20 and 21. ER—entorhinal cortex (Brodmann's area 28). MST—medial superior temporal area; likely to include at least two functional subdivisions (Rosa & Elston 1998). A1—densely myelinated, auditory ‘core’ field; surrounded by other auditory areas (‘aud’). S1—densely myelinated, somatosensory ‘core’ field; surrounded by other somatosensory areas (‘som’; Krubitzer & Kaas 1990a). M1 and PM—motor and premotor areas, defined on the basis of cytoarchitectural criteria. vis—visuomotor sector of the frontal lobe, defined on the basis of connections with extrastriate cortex; may include various subdivisions (Krubitzer & Kaas 1990b).
Figure 2
Figure 2
Visuotopic organization of the marmoset visual cortex. (a) Lateral view of the right hemisphere, showing the anatomical relationships within the cortical regions illustrated in part (b). Parts of the cerebral cortex normally hidden from view (those located along the midline and ventral surface) were ‘unfolded’, and a discontinuity was introduced along the representation of the horizontal meridian in V1 (dashed arrows). Grey lines indicate borders of cortical areas, labelled as in figure 1. (b) Unfolded map of the posterior neocortex. The thick dashed lines indicate the dorsal and ventral limits of the cortex that is normally exposed on the surface of the brain. The numbers to the left of V1 indicate the range of receptive field centre eccentricities observed within the regions coded by different shades of grey (0–2, 2–4, 4–8°, etc.). Representations of the horizontal and vertical meridians are labelled by black squares and white circles, respectively, and the representations of upper and lower quadrants by the ‘+’ and ‘−’ signs, as indicated in the visual field diagram (bottom left).
Figure 3
Figure 3
Bidimensional maps of the entire cerebral cortex of four species of simian primates, with selected cortical areas indicated. To minimize distortions, the cortex corresponding to V1 was detached from the map, following the style suggested by Van Essen & Maunsell (1980). Top left: marmoset (Callithrix jacchus); map based on Rosa & Elston (1998); Rosa & Tweedale (2000) and ongoing cytoarchitectural analyses. Top right: capuchin (Cebus apella); map based on Rosa et al. (1993b; 2000a,b;) and unpublished cytoarchitectural data. Middle left: macaque (Macaca fascicularis); based on Felleman & Van Essen (1991). Bottom: human (Homo sapiens); based on Van Essen (2004) and a computer reconstruction of Brodmann's cytoarchitectural areas (available at http://brainmap.wustl.edu/caret/slides/human.03-06/). Note, however, that in generating this illustration the contours of V1 (area 17) were detached from the map, then combined so as to follow the same style as the monkey maps. The contours of human V2 and V4 are incomplete, reflecting the difficulty in stimulating the visual field periphery in fMRI experiments. Measurements of cortical magnification factor (Sereno et al. 1995) indicate that, as in macaques (Sincich et al. 2003), this area is nearly as large as V1.
Figure 4
Figure 4
Vibratome slices through flat-mounted preparations of the posterior neocortex of three marmosets, showing the distinctive architecture of area MT. Caudal is towards the left, and dorsal towards the top of each panel. These slices have not been stained, and the borders of V1 (arrows) and MT are made visible only by differences in myelination (highly myelinated regions appearing lighter). The borders of MT are distinct throughout, while those of V1 are clearer in the deeper layers (right panel). The primary auditory cortex appears as another heavily myelinated region, just below the lip of the lateral sulcus (left panel). For details, see Rosa & Elston (1998).
Figure 5
Figure 5
Formation of visuotopic maps in brains of different sizes, according to the ‘molecular anchors’ hypothesis (for additional details, see Rosa 2002). The visuotopic organization of the cortex is indicated according to the key shown in the top right panel. The left column represents an early stage of development, and the right column a late stage of development. The grey scale represents the sequence of maturation (dark, more mature cortex). Two primary visual maps (corresponding to adult V1 and MT, the only first-order representations in the adult brain) are specified early in development (left), either by gradual distributions of cell surface chemoattractant/chemorepellent molecules (O'Leary et al. 1999) or by spatio-temporal patterning of the afferent projections (Molnár et al. 1998). With the V1 and MT maps defined, the visuotopic maps in adjacent areas (e.g. V2) start to self-organize around these ‘anchors’. Two rules guide this process: (i) the receptive fields of neurons in adjacent columns must overlap; this rule constrains the configuration of maps forming at later stages of development, which must be ‘anchored’ in pre-existing maps; and (ii) the gradient of representation does not revert within a given area (arrows in the left panels); this ensures that the same part of the visual field is not represented more than once in a given area, except along its boundaries. Throughout pre- and postnatal development, activity-dependent mechanisms allow the fine-tuning of the maps. However, for any given area, the degree of plasticity decreases gradually with age (e.g. Waleszczyk et al. 2003). Upper row: the visual cortex of flying foxes is used as an example of small primate-like cortex. In this species, there is little cortex between V1 and the occipitotemporal area (OT; a probable homologue of primate MT). In the adult (right column), this region includes only two visuotopic maps (V2 and V3), which form precise mirror-images (Rosa 1999). Middle row: the visual cortex of a marmoset. Here, four maps (V2, V3, V4 and MTc) exist between V1 and MT. The visual topographies of V3 and V4, which mature last, are the least precise, and most variable between individuals. Bottom row: the human visual cortex, where the cortex between V1 and MT is more expansive, and includes additional areas in which the visuotopic organization is less clear (e.g. Tootell & Hadjikhani 2001). Expansion of the cortex between primary areas results in multiple reversals of visual field representation (and hence ‘areas’). Maps which self-organize at progressively later stages of development are constrained only by areas with progressively larger receptive fields and representational scatter. Thus they can become less and less precise, without violating rules 1 and 2 above.
Figure 6
Figure 6
Models of the organization of the dorsal ‘third tier’ cortex in New World marmoset monkeys. (a) and (b) are schematic ‘unfolded’ views of the caudal neocortex showing the locations of well-defined areas (V1, V2 and MT), as well as other, more controversial subdivisions. The anatomical relationships in these diagrams are illustrated in the insert (top right), which includes a lateral view of the marmoset brain (right hemisphere) with ‘flaps’ of medial and ventral cortex unfolded to create a global view of the extrastriate cortex; the arrow indicates a discontinuity introduced along the long axis of V1. (a) The model advocated by Lyon & Kaas (2001) on the basis of anatomical tracing of V1 connections and histological examination of flat-mounted histological material stained for cytochrome oxidase. In this model, the dorsal third tier cortex is dominated by the lower quadrant representation of area V3, which also includes an upper quadrant representation in ventral cortex. A smaller area DM is located entirely rostral to V3. (b) The model proposed by Rosa & Schmid (1995) and Rosa & Tweedale (2000) on the basis of electrophysiological recordings and analysis of myelin-stained sections. Here, the third visual complex includes both a smaller V3, and area DM; the latter has representations of both the upper and lower quadrants adjacent to V2. The visuotopic organization is indicated according to the symbols summarized in the bottom right diagram: representations of the vertical meridian in black squares, representations of the horizontal meridian in white circles, representations of the upper quadrant in ‘+’ signs and representations of the lower quadrants in ‘−’ signs. Gradients of eccentricity are indicated by levels of grey (white, light grey: central representation; dark grey, black: peripheral representation). Abbreviations: V3(d), dorsal component of V3; V3(v), ventral component of V3.
Figure 7
Figure 7
Topographic transition between areas in the dorsal extrastriate cortex of a marmoset. This sequence of receptive fields and recording sites demonstrates the absence of a V3-like area inserted between V2 and the dorsomedial area (DM), at least in some species of New World monkey. Top left: parasagittal section (left hemisphere; rostral is to the left), showing electrode tracks and the region that is enlarged in the bottom left panel. Bottom left: location of recording sites, numbered consecutively according to their radial projection to layer four. Recording sites in V2 are shown by white circles, those in DM by black circles, and those in cortex rostral to DM (area DA and the posterior parietal cortex, as defined by Rosa & Schmid 1995) by white squares. Arrows point to the V1/V2 border, to the border between V2 and DM (evident by a sudden increase in myelination), and to the rostral border of DM (marked by an increased separation of the bands of Baillarger). Middle and right: receptive fields recorded in V2, DM and in the cortex rostral to DM. In V2, receptive fields corresponding to progressively more rostral sites move gradually from the vertical meridian towards the horizontal meridian. After the DM border is crossed, the receptive fields become larger, but do not revert towards the lower vertical meridian, as would be expected if V3 existed at this level; instead, they progress to invade the upper visual field.
Figure 8
Figure 8
Visuotopic organization of DM, as revealed by (a) anatomical tracing and (b) electrophysiology. (a) Schematic view of the spatial relationship between the locations of injection sites of retrograde tracers in DM (numbered circles) and labelled patches in V1. The outlines of the areas correspond to the contours of V1 and DM in the various cases with injections, aligned and scaled to equal area. The locations of the representations of the fovea (star) and horizontal meridian (dotted line) in V1 are indicated. Injections near the caudal border of DM result in label including the horizontal meridian representation (light patches, 1–5). Injections in the lateral half of DM result in label in the upper visual field representation of V1 (dark grey patches, 6–9), while those in the medial half of DM result in label in the lower visual field representation (medium grey, 10–13). (b) Summaries of the visuotopic organizations of V1 and DM, each based on hundreds of recording sites (V1: redrawn from fig. 8 of Fritsches & Rosa 1996; DM: redrawn from fig. 17 of Rosa & Schmid 1995). The visual field representation is coded according to the diagram shown on the right: representations of the vertical meridian in black squares, representations of the horizontal meridian in white circles, 45° isopolar contours in solid line, isoeccentricity contours in dashed line, representations of the upper quadrant in ‘+’ signs, and representations of the lower quadrants in ‘−’ signs. The stars indicate a line of field discontinuity through the upper quadrant that characterizes the DM map.
Figure 9
Figure 9
Comparison of the organization of extrastriate areas in macaque (left) and marmoset (right) monkeys. (a) Comparison of the organization of the dorsal extrastriate cortex rostral to V2. In both panels, the representation of the lower quadrant (−) is shown in light grey, and that of the upper quadrant (+) in dark grey. In addition, foveal representations are indicated by stars, isoeccentricity lines by dashed lines, representations of the vertical meridian by black squares, and those of the horizontal meridian by circles (see insert at the left). (a) Left: the visuotopy of macaque area V6 is illustrated in dorsal (bottom) and medial (top) views of the brain, with the sulci partially unfolded (redrawn, with different symbols and orientation, from Galletti et al. 1999). The double-ended arrows join corresponding points of the rostral bank of the parietooccipital sulcus, so as to indicate the topological continuity between the medial and dorsal views illustrated. The lips and fundi of the sulci are shown as continuous lines, and the rostral border of V6A as a dotted line. The dark grey oval adjoining the lateral end of V6 indicates the likely location of the central upper quadrant representation in this area, which was not studied in detail by Galletti et al. (1999). The representation of the upper vertical meridian in V6 is hidden from view, being located near the fundi of the sulci. The boxed regions in the inserts (far left) show the approximate location of the illustrated regions in the intact macaque brain. (a) Right: visuotopy of area DM illustrated in dorsomedial (bottom) and medial (top) view of the marmoset brain (Rosa & Schmid 1995). The marmoset brain has no sulci in this region. The representation of the central upper quadrant in this species has been mapped in detail (dark grey region at the lateral extreme of DM), and occupies a region equivalent to that proposed for the equivalent region of V6. (b) Comparison of the visuotopic organization of lateral and ventral cortices, including a new hypothesis on the extent of dorsal V3. Left: lateral view of the right hemisphere of a macaque brain in which the sulci and the ventral surface were partially ‘unfolded’ to allow visualization of the cortical areas. The visuotopic organization is indicated according to the following symbols: the foveal representation is shown by stars, vertical meridian representations are indicated by black squares, horizontal meridian representations by white circles, upper quadrant representations by ‘+’ and lower quadrant representations by ‘−’. The visuotopic organizations of V1 and V2 are based on Gattass et al. (1981), and the organizations of MT, V4 and V4t are based on Gattass et al. (1988). The visuotopy of ventral V3 is also based on Gattass et al. (1988). However, the extent of dorsal V3 was redefined so that the vertical meridian representation crosses the prelunate gyrus, as proposed by Maguire & Baizer (1984) and Youakim et al. (2001). This redefinition of the extent of dorsal V3 results in an organization that strongly resembles the one found in New World monkeys (b) right, from Rosa & Tweedale 2000). See also figure 10.
Figure 10
Figure 10
A new hypothesis on the organization of dorsal extrastriate cortex in Old World monkeys, based on our studies in New World monkeys. The key point here is to demonstrate that the raw data on which the currently accepted subdivision of the macaque cortex is based are equally compatible with another interpretation (illustrated in figure 9b). Left: original interpretation of boundaries of visual areas in the macaque dorsal cortex, based on Gattass et al. (1988) and Colby et al. (1988). This diagram represents a bidimensional reconstruction of the macaque caudal extrastriate cortex, with the visual topography of V2, V3, V3A, V4, V4t and PO indicated (dark area represents the central 1° of the visual field, dashed lines are isoeccentricity lines; see insert for other symbols). The fine dotted lines indicate boundaries of areas which were interpolated based on myeloarchitectural evidence. Redrawn from fig. 5 of Gattass et al. (1988), with the exception of the organization of V3A, which was based on figs. 3, 8, 11 and 13 of the same reference, and PO, which was based on Colby et al. (1988). Right: a re-interpretation of the same data, based on our studies of New World monkeys and on the studies of Maguire & Baizer (1984) in the macaque. In this model, a lower quadrant representation previously assigned to ‘V3A’ (corresponding to Maguirre and Baizer's area PM) forms the continuation of VP into the anterior bank of the lunate sulcus and prelunate gyrus. This would result in a ‘V3’ forming a complete representation of the visual field, similar to the New World monkey V3 (see figure 9b; right). The most medial part of the original ‘dorsal V3’, combined with area PO, forms the homologue of New World monkey DM (V6 of Galletti et al. 1999).
Figure 11
Figure 11
Two views on the organization of the macaque third visual complex. (a) Topographic organization of the caudal cortex between V1 and V4, as revealed by fMRI data (Brewer et al. 2002). The representation of polar angles is indicated by different colours, according to the key illustrated in the inserts. The arrows point to ‘anomalous’ sectors of upper quadrant representation found in the middle of dorsal V3. (b) A ‘classical’ interpretation of these data, including a V3 that is mirror-symmetrical to V2 and another area, V3a, located entirely anterior to V3. (c) A re-interpretation of the same observations, according to the hypothesis illustrated in figures 9b and 10. We submit that the revised borders, which imply two areas (V3 and DM, or V6) adjacent to V2, provide a better fit to the raw data. Scale bar, 5 mm.
Figure 12
Figure 12
Hypothetical views of the functional and anatomical transitions at the boundary of two cortical areas. Each diagram represents a number of cellular columns spanning from layer one (top) to the white matter (bottom), and two populations of afferent axons. Left: in this case, the border is unambiguous—anatomical and functional definitions coincide. This is because during development the afferent connections have segregated along a precise border, creating a sharp functional transition between cells with one type of neural response (dark columns) and those with a different type of neural response (white columns). This could also result in sharp histological transitions (for example, if afferent 1 represented a highly myelinated, fast conducting pathway, and afferent 2 a less myelinated pathway). Right: because the proportions of cells with different response properties and connections change gradually, in this second case the border is ambiguous as far as can be assessed by any single criterion. For example, based on the pattern of connections, one may recognize two areas that gradually merge onto each other, or three areas defined by different combinations of afferents. The histological characteristics would also be expected to change gradually.

References

    1. Adams D.L, Horton J.C. Capricious expression of cortical columns in the primate brain. Nature Neurosci. 2003;6:113–114. - PubMed
    1. Allman J.M, Kaas J.H. A representation of the visual field in the caudal third of the middle temporal gyrus of the owl monkey (Aotus trivirgatus) Brain Res. 1971;31:85–105. - PubMed
    1. Allman J.M, Kaas J.H. The dorsomedial cortical visual area: a third tier area in the occipital lobe of the owl monkey (Aotus trivirgatus) Brain Res. 1975;100:473–487. - PubMed
    1. Amedi A, Jacobson G, Hendler T, Malach R, Zohary E. Convergence of visual and tactile shape processing in the human lateral occipital complex. Cereb. Cortex. 2002;12:1202–1212. - PubMed
    1. Azzopardi P, Fallah M, Gross C.G, Rodman H.R. Response latencies of neurons in visual areas MT and MST of monkeys with striate cortex lesions. Neuropsychologia. 2003;41:1738–1756. - PubMed

Publication types