

Review
doi: 10.1098/rstb.2005.1628.
Visual field map clusters in human cortex
Affiliations
- PMID: 15937008
- PMCID: PMC1569486
- DOI: 10.1098/rstb.2005.1628
Item in Clipboard
Review
Visual field map clusters in human cortex
Philos Trans R Soc Lond B Biol Sci.
.
Abstract
We describe the location and general properties of nine human visual field maps. The cortical location of each map, as well as many examples of the eccentricity and angular representations within these maps, are shown in a series of images that summarize a large set of functional MRI data. The organization and properties of these maps are compared and contrasted with descriptions by other investigators. We hypothesize that the human visual field maps are arranged in several clusters, each comprising a group of maps that share a common foveal representation and semicircular eccentricity map. The spatial organization of these clusters suggests that the perceptual processing within each cluster serves related functions.
Figures

Rendering the cortical surface. (a) A rendering of a white–grey matter boundary in the human brain. The surface is estimated from anatomical MRI scans (1 × 1 × 1 mm3). The shading indicates the local curvature: light shading indicates a gyrus and dark shading a sulcus. (b) The same surface is rendered after smoothing. The shading on the smoothed surface is the same as in the original. In the following figures, we illustrate the properties and positions of the visual field maps on the smooth surface to reveal more of the data in a single image while still providing the general cortical position. Ca-S: calcarine sulcus. PO-S: parietal-occipital sulcus. IP-S: intraparietal sulcus.

The locations of nine hemifield maps in the human visual cortex. The maps are shown for one typical subject (AB).
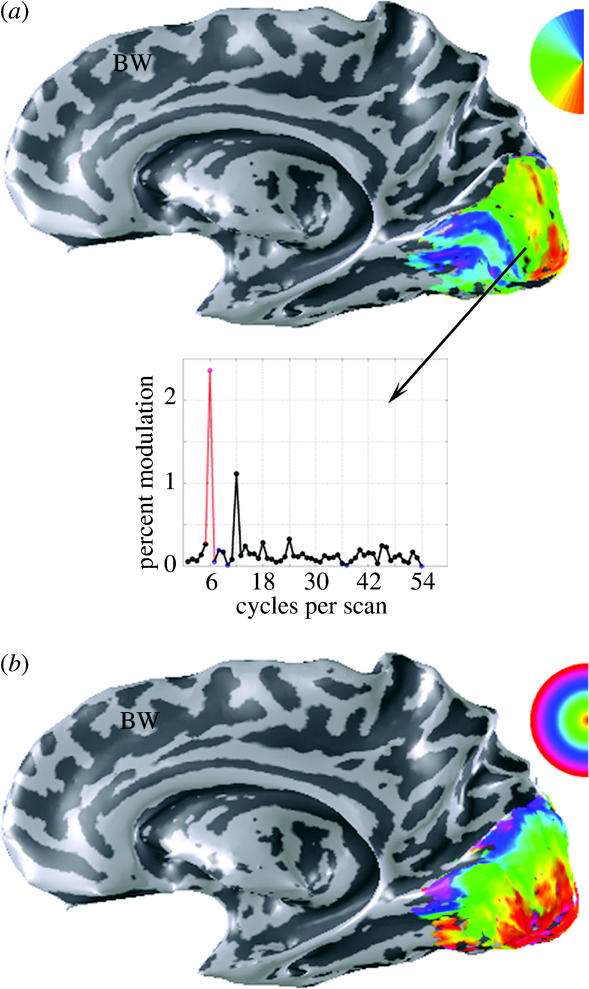
Angular and eccentricity maps near the calcarine cortex. Maps were measured using (a) rotating wedges and (b) expanding rings comprising contrast-reversing dartboard patterns (Wandell 1999). The stimuli extended over the central 20 degrees of the visual field and completed six cycles during each experimental scan. The colour overlay indicates the visual field angle (a) or eccentricity (b) that produces the most powerful response at each cortical location (see the coloured legends on the right). For clarity, only responses near the calcarine cortex are shown. The graph plots the response amplitude as a function of temporal frequency as measured in a 3 mm radius disk located in the calcarine (see arrow). The response is significantly greater at the stimulus repetition frequency (6 cycles per scan, shown in red) than other temporal frequencies. The secondary peaks at integer multiples of the stimulus frequency are expected and are also significant. Throughout, we include these graphs in images to provide the reader with an assessment of the reliability of the responses. The stimulus-driven responses shown in this paper are substantially above statistical threshold (p<0.001, uncorrected).
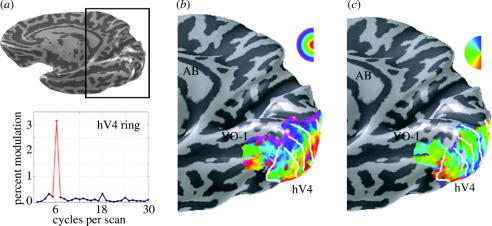
Eccentricity and angular measurements illustrating ventral occipital maps hV4 and VO-1. (a) The right hemisphere ventral occipital region of interest. (b) Eccentricity measurements using a 3 degree expanding ring stimulus. The graph shows the signal amplitude measured in a 5 mm radius disk centred in hV4. The response to the wedge in VO-1 was of comparable magnitude. (c) Angle measurements using a 3 degree rotating wedge stimulus. White lines indicate the estimated boundaries between several visual field maps, including the ventral portions of V1, V2 and V3 (maps not labelled) as well as hV4 and VO (labelled). Other details as in figure 3.

Eccentricity measurements in dorsal occipital maps V3A, V3B and V7. (a,b) Eccentricity measurements using a 3 degree expanding ring stimulus in two subjects (LG and JL). The arrows indicate two foveal representations. The confluent foveal (yellow/green) representations of V3A and V3B can be seen in the relatively posterior region of the intraparietal sulcus. The graph measures the signal amplitude in this foveal representation (LG, 5 mm radius disk). The relatively anterior foveal representation is part of the V7 map. A fairly complete map is visible for LG and a partial but consistent map is seen in JL. (c) Eccentricity measurements using a 20 degree expanding ring (BW). The same eccentricity map is present, in particular note the semicircular map near V3A and V3B. In addition, note the foveal responses (orange/red) in the very anterior portion of the intraparietal sulcus. Such activity is frequently present and suggests that additional maps exist along the intraparietal sulcus (Sereno et al. 2001). For clarity, only responses near the intraparietal sulcus are shown. Other details as in figure 3.

Angular measurements in dorsal occipital maps V3A, V3B and V7. (a,b) Angular maps for V3A and V3B in the left hemisphere of LG and AB were measured using 3 degree (LG) and 20 degree (AB) stimuli. The white lines delimit two hemifield maps, responding to lower (red/yellow) and upper (blue/cyan) vertical meridians. A lower vertical meridian representation separates V3 from V3A/V3B; an upper vertical meridian representation separates V3A/V3B from V7; and a lower vertical meridian is present at the anterior boundary of V7. The graphs measure the relative reliability of the signals in the different maps as well as in the anterior intraparietal sulcus (AB). Note also the signals present in the anterior intraparietal sulcus. (c) Angular measurements in the right hemisphere using a 20 degree stimulus (BW). The lower (red/yellow) and upper (cyan/blue) vertical meridians, defining V3A and V3B, are clearly visible. The signal is weak at the anterior border of V7. The corresponding eccentricity maps for LG and BW are shown in figure 5. Corresponding measurements exist (not shown) for AB and JL. Other details as in figure 5.

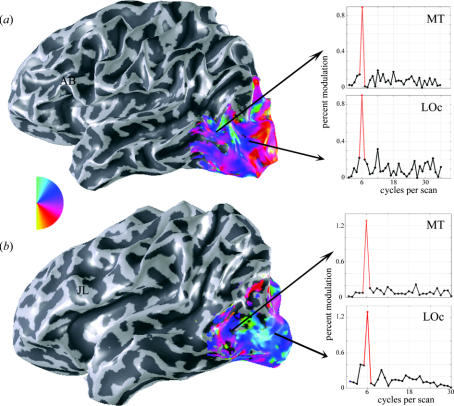
Eccentricity measurements in lateral occipital cortex. Regions of interest in the right and left lateral occipital cortex are shown in the images at the left. Eccentricity measurements using 20 degree expanding ring stimulus in one left hemisphere (AB) and two right hemispheres (BW, AW) are shown. The arrows indicate the semicircular eccentricity maps in hMT+. While the preferred central phase in V1 is fairly consistent (red), there is variation in the preferred central phase in hMT+, (orange, to yellow, to green). This variation colour is representative of our data. For clarity, only responses in the dorsal and lateral occipital cortex are shown. The graphs measure the signal amplitude in this region in two subjects (3 mm radius disk). Other details as in figure 3.
Angular measurements in the lateral occipital cortex. Rotating wedge measurements using 3 degree stimuli are shown for subject AB (a) and subject JL (b). The graphs indicate that there are significant responses to these stimuli in the lateral occipital cortex (3 mm radius disk). These data suggest that it will be possible to identify visual field maps. In this region, responses to 3 degree stimuli tend to be larger than responses to 20 degree stimuli (cf. figure 7). Other details as in figure 3.
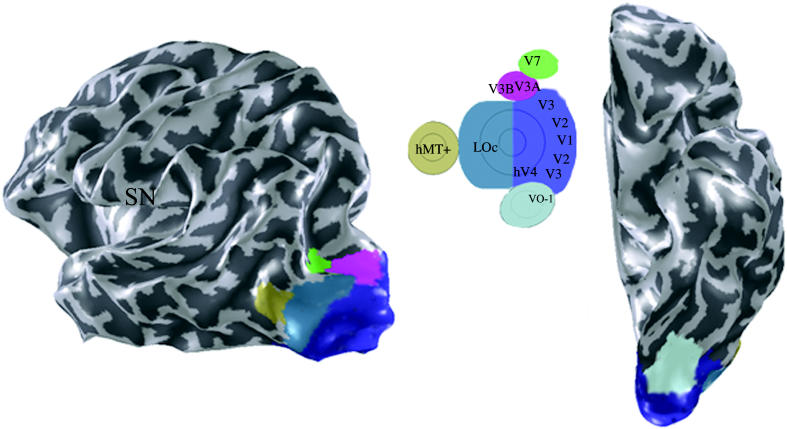
Six candidate visual map clusters. A suggested organization of the visual clusters in a typical subject (SN). Each cluster contains a foveal representation, semicircular eccentricity map and one or more hemifield maps. The images show a lateral (left) and ventral (right) view. The inset is a schematic flat map of the cluster organization. At least one map has been identified in five clusters, but others may be found. No maps have been securely identified in LOc, but the data in figures 7 and 8 suggest that maps will be found.
References
-
- Artal P, Chen L, Fernandez E.J, Singer B, Manzanera S, Williams D.R. Neural compensation for the eye's optical aberrations. J. Vis. 2004;4:281–287. - PubMed
-
- Backus B.T, Fleet D.J, Parker A.J, Heeger D.J. Human cortical activity correlates with stereoscopic depth perception. J. Neurophysiol. 2001;86:2054–2068. - PubMed
-
- Bartels A, Zeki S. The architecture of the colour centre in the human visual brain: new results and a review. Eur. J. Neurosci. 2000;12:172–193. - PubMed
-
- Baseler H.A, Brewer A.A, Sharpe L.T, Morland A.B, Jagle H, Wandell B.A. Reorganization of human cortical maps caused by inherited photoreceptor abnormalities. Nat. Neurosci. 2002;5:364–370. - PubMed
Publication types
MeSH terms
Grants and funding
LinkOut - more resources
Full Text Sources
Other Literature Sources
