Review
. 2005 Apr 29;360(1456):709-31.
doi: 10.1098/rstb.2005.1629.

Cortical visual areas in monkeys: location, topography, connections, columns, plasticity and cortical dynamics

Affiliations
Review

Cortical visual areas in monkeys: location, topography, connections, columns, plasticity and cortical dynamics

Ricardo Gattass et al. Philos Trans R Soc Lond B Biol Sci. .

Abstract

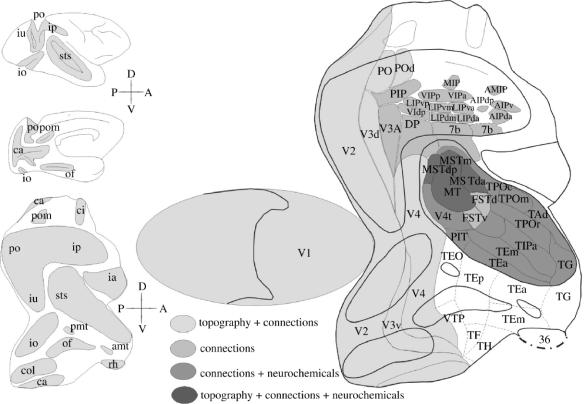
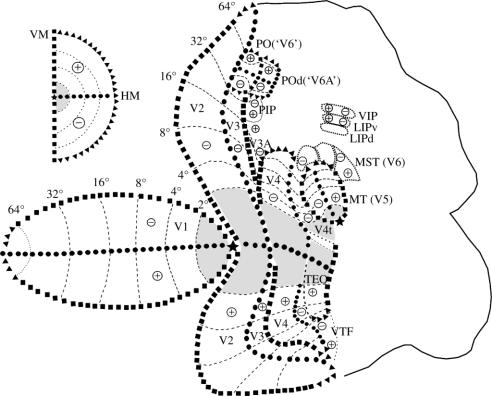
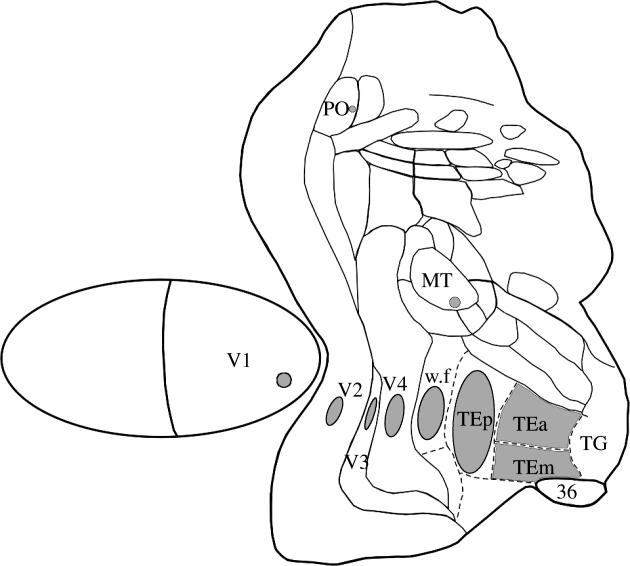
The visual system is constantly challenged to organize the retinal pattern of stimulation into coherent percepts. This task is achieved by the cortical visual system, which is composed by topographically organized analytic areas and by synthetic areas of the temporal lobe that have more holistic processing. Additional visual areas of the parietal lobe are related to motion perception and visuomotor control. V1 and V2 represent the entire visual field. MT represents only the binocular field, and V4 only the central 30 degrees-40 degrees. The parietal areas represent more of the periphery. For any eccentricity, the receptive field grows at each step of processing, more at anterior areas in the temporal lobe. Minimal point image size increases towards the temporal lobe, but remains fairly constant toward the parietal lobe. Patterns of projection show asymmetries. Central V2 and V4 project mainly to the temporal lobe, while peripherals V2 (more than 30 degrees) and V4 (more than 10 degrees) also project to the parietal lobe. Visual information that arrives at V1 projects to V2, MT and PO, which then project to other areas. Local lateral propagation and recursive loops corroborate to perceptual completion and filling in. Priority connections to temporal, parietal and parieto-temporal cortices help construct crude early representations of objects, trajectories and movements.


Figures

Figure 1
Figure 1
Two-dimensional reconstruction of the monkey cortex, showing the location of the extrastriate visual areas found in Macaca and in Cebus. The flattened map of V1 was separated from the extrastriate cortex to allow physical flattening of the 3D model of the posterior portion of the hemisphere. Heavy lines indicate the boundaries of the sulci; thin lines indicate the boundaries of the visual, visuomotor and polysensory areas. The dashed lines indicate the boundaries of the temporal areas defined in the macaque, based on cortical connections. The dot–dash lines indicate the boundaries between the neocortex and allocortex. Different grey densities label areas defined by different combination of methods. The grey area on the lateral and medial views of the hemisphere (upper right) and indicated on the 2D reconstruction (lower right) indicate cortex within sulci. Different patterns illustrate the criteria used to define the borders of the areas. White areas in the temporal lobe were defined only in the Macaca. d, dorsal; v, ventral; p, posterior; a, anterior. For names of areas and sulci, see glossary.
Figure 2
Figure 2
Visuotopic organization of the cortical visual areas shown on a 2D reconstruction of a monkey cortex. The vertical meridian is represented by black squares, the horizontal meridian by black circles, the eccentricity lines by dashed lines, the visual field periphery by black triangles. A star illustrates the representation of the fovea. + and − show upper and lower fields, respectively. Insert illustrates the contralateral visual hemi-field. For names of areas, see Glossary.
Figure 3
Figure 3
Anisotropies in cortical visual maps illustrated by the asymmetries of the minimal point image size in different visual areas, shown on a 2D reconstruction of a monkey cortex.
Figure 4
Figure 4
Changes in blob cross-sectional area in V1 after massive (a) and focal (b) retinal laser lesions at different times, from 3 to 43 days. Undeprived blob sizes (continuous lines) increase after massive retinal lesions. Deprived blob sizes (dashed lines) decrease drastically in both cases. Bars, standard error of the mean; C, control (non-lesioned area).
Figure 5
Figure 5
Schematic of the laminar distribution of cell bodies (asterisks) and neuropils (greys) in coronal sections of V1, stained for parvalbumin (a) and calbindin (b), after massive retinal laser lesions. Schematics of the stains are illustrated for normal and for deprived (D) and undeprived (U) columns.
Figure 6
Figure 6
Direction map and single-unit in MT: illustration of neuronal responses that gave rise to a pinwheel map formation. (a) Visual topography of MT showing the location of map region highlighted in panel b. Three minimal point image sizes in MT are illustrated at different eccentricities. (b) Magnified view of a rectangular region of cortex showing a portion of the direction map with a pair of directional singularities (at centre and lower right) with corresponding pinwheel formations, which are linked by a fracture. Each pinwheel is composed of a half-rotation (180°) and a fracture. White crosshairs indicate the locations of five recording sites, which include a site near the pinwheel centre and four sites around the perimeter. The central site exhibited a weak form of directional tuning that was entirely shaped by inhibition. The remaining sites were excitatory and uni-directional. Dashed circle, spontaneous firing rate; external circle, maximum firing rate at the recording site.
Figure 7
Figure 7
Projections to visual area PO (left), projection from peripheral V2 (middle) and connections from central and peripheral V4 (right) represented onto a 2D reconstruction of the monkey visual cortex. The connections to area PO arise from the peripheral representation of areas V1, V2, V3, V3A, V4, V4t, TEO, MT, MST, VIP, LIP and POd; the projection from peripheral V2 encompass areas V1 (not shown), V2, V3, V3A, V4, V4t, MT, MST and VIP; the connection of the central V4 feedback to areas V2 and V3 and project forward to MT, V4t, and to the temporal lobe areas (TEO, TEp, TEm, TEa), while the connection from peripheral V4 projects also to the parietal areas (PO, PIP, V3A, DP, MST, VIP, LIP and 7a).
Figure 8
Figure 8
Topographically organized networks in different streams of visual information processing. Three topographically organized networks link different cortical visual areas, at different eccentricities. These networks process the visual information in parallel, one with emphasis on central or object vision (black circle), another with emphasis on object trajectory or object motion (grey circle) and another with emphasis on peripheral vision or forward egocentric motion (white circle).
Figure 9
Figure 9
Changes of direction selectivity in V2 after GABA inactivation in MT. Activity of two cells at topographically corresponding locations in MT and V2, before and after GABA inactivation of MT. The directional selectivity (polargram) and the post-stimulus histogram at the preferred direction are shown for both cells 1, 44 and 66 min after GABA injections in MT. The response of the V2 neuron decreases and its direction selectivity changes while the topographically corresponding location in MT is inactivated. Solid circle, maximum spike rate of the cell; dashed circle, spontaneous spike rate.
Figure 10
Figure 10
Precision of receptive field location and discrepancy of orientation selectivity. (a) Location of receptive field centres mapped through the contralateral (filled circles and solid line) and ipsilateral (open circles and dotted line) eyes corresponding to 11 recording sites in V1 across the representation of the contralateral optic disc, N, nasal. (b) Difference in horizontal receptive field position (scatter) and difference in direction/orientation selectivity of the receptive fields for the contralateral and ipsilateral eye, for 123 recording sites. (c,d ) Representations of the receptive field response in the space domain, for the centres marked by arrows in (a), based on the single-unit responses to eight different directions The ellipse in the contralateral eye represents the optic disc position. Spike rate for each eye is colour-coded (right: colour scale).

Similar articles

Cited by

References

    1. Albright T.D. Direction and orientation selectivity of neurons in visual area MT of the macaque. J. Neurophysiol. 1984;52:1106–1130. - PubMed
    1. Allman J.M, Kaas J.H. A representation of the visual field in the caudal third of the middle temporal gyrus of the owl monkey (Aotus trivirgatus) Brain Res. 1971;31:85–105. - PubMed
    1. Allman J.M, Kaas J.H. A crescent-shaped cortical visual area surrounding the middle temporal area (MT) in the owl monkey (Aotus trivirgattus) Brain Res. 1974;81:199–213. - PubMed
    1. Allman J.M, Kaas J.H. The dorsomedial cortical visual area: a third tier area in the occipital lobe of the owl monkey (Aotus trivirgatus) Brain Res. 1975;100:473–487. - PubMed
    1. Allman J.M, Kaas J.H, Lane R.H, Miezin F.M. A representation of the visual field in the inferior nucleus of the pulvinar in the owl monkey. Brain Res. 1972;40:291–302. - PubMed

Publication types

Substances