Review
. 2005 Apr 29;360(1456):733-50.
doi: 10.1098/rstb.2005.1627.

The chronoarchitecture of the cerebral cortex

Affiliations
Review

The chronoarchitecture of the cerebral cortex

Andreas Bartels et al. Philos Trans R Soc Lond B Biol Sci. .

Abstract

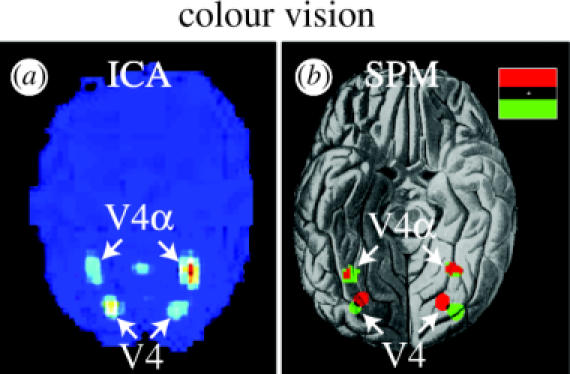
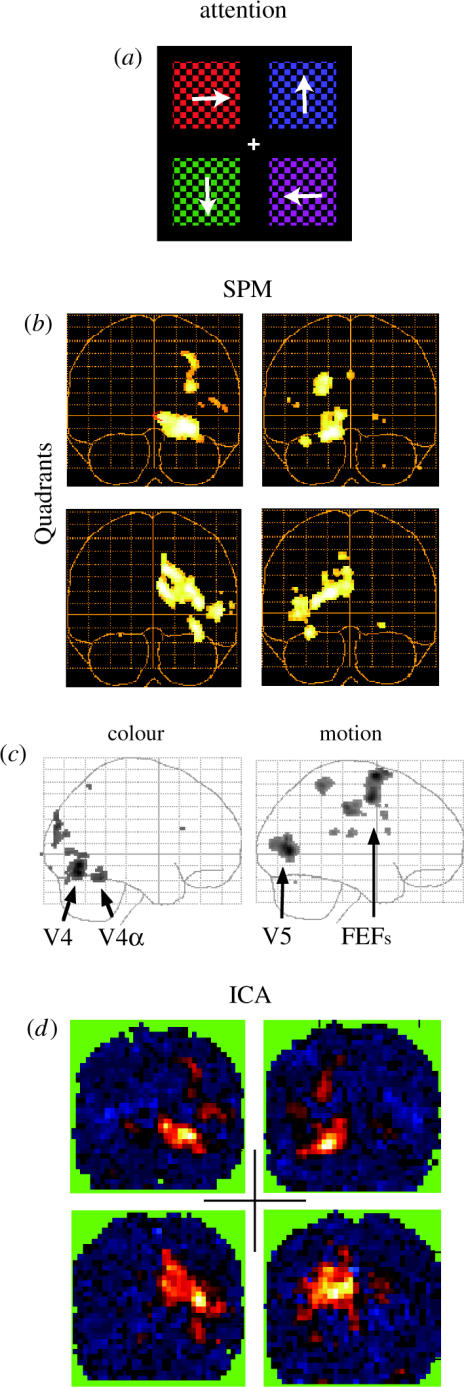
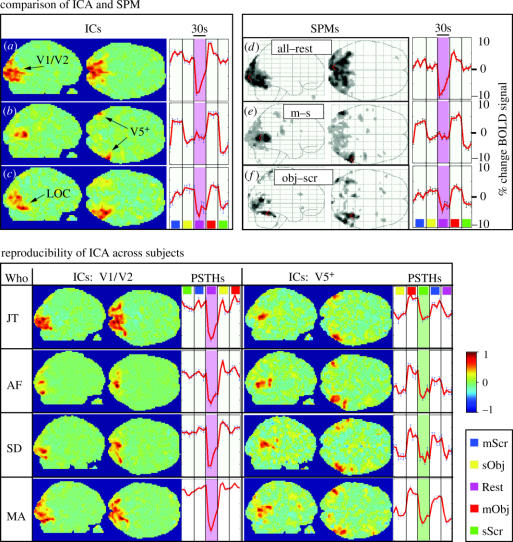
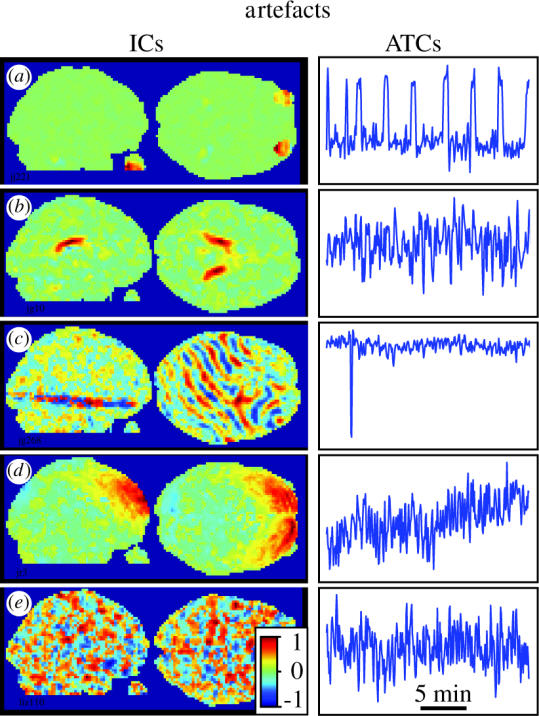
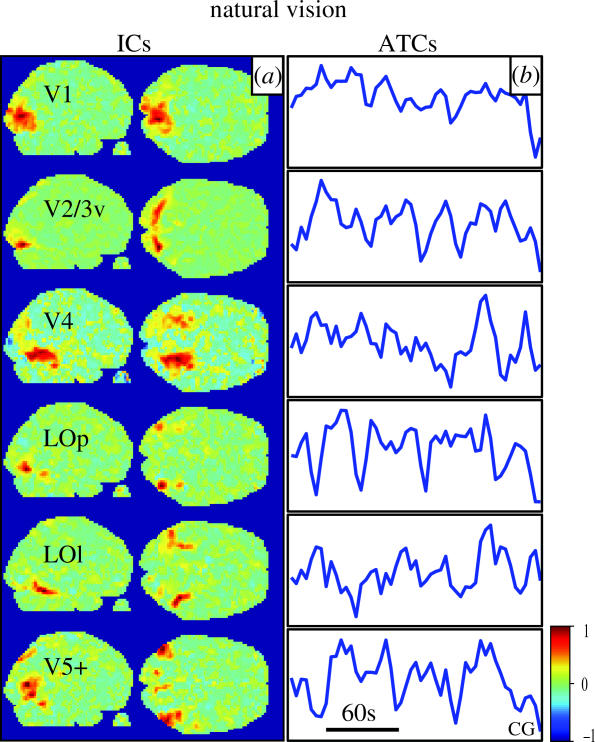
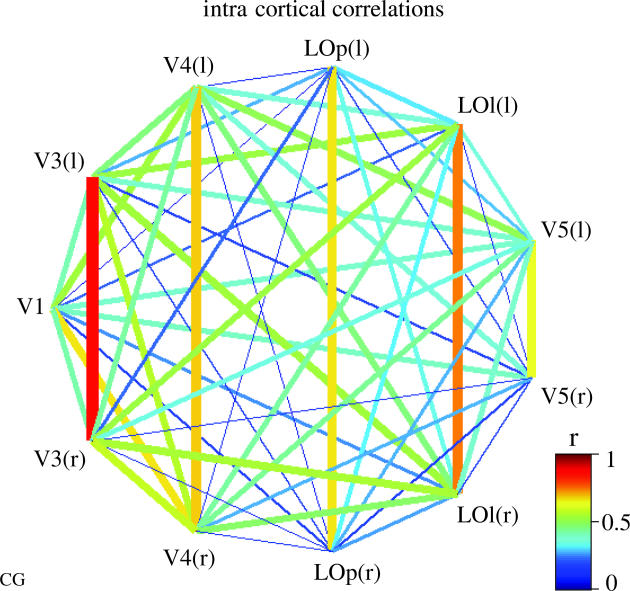
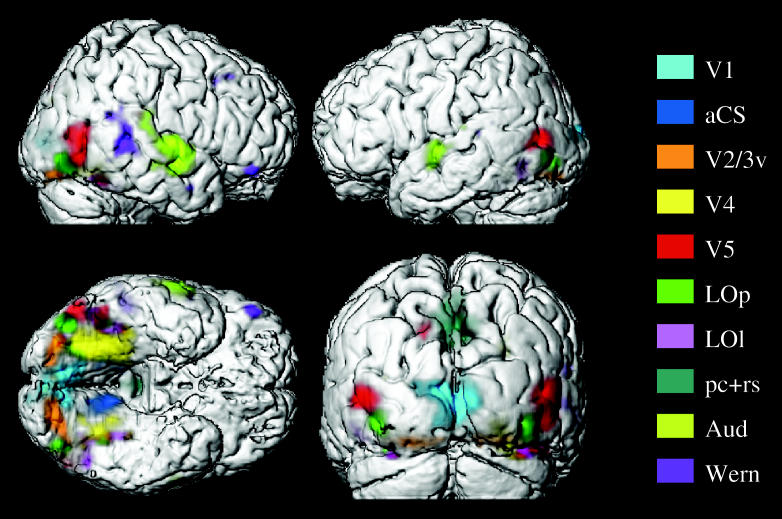
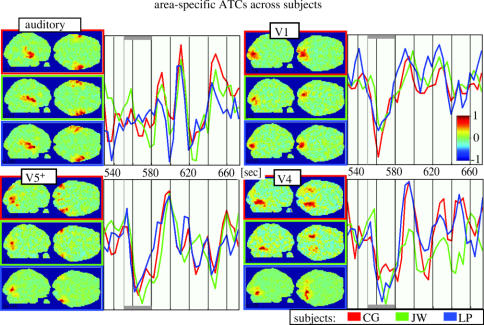
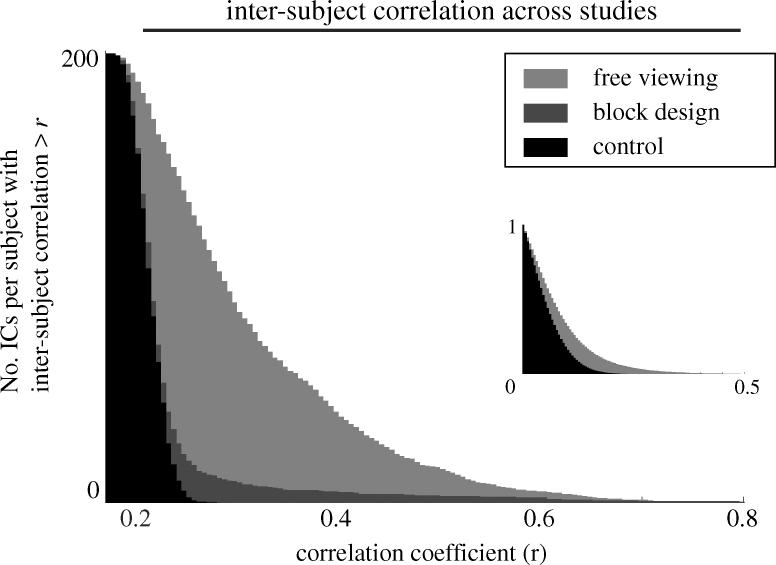
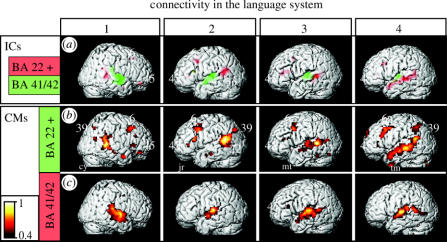
We review here a new approach to mapping the human cerebral cortex into distinct subdivisions. Unlike cytoarchitecture or traditional functional imaging, it does not rely on specific anatomical markers or functional hypotheses. Instead, we propose that the unique activity time course (ATC) of each cortical subdivision, elicited during natural conditions, acts as a temporal fingerprint that can be used to segregate cortical subdivisions, map their spatial extent, and reveal their functional and potentially anatomical connectivity. We argue that since the modular organisation of the brain and its connectivity evolved and developed in natural conditions, these are optimal for revealing its organisation. We review the concepts, methodology and first results of this approach, relying on data obtained with functional magnetic resonance imaging (fMRI) when volunteers viewed traditional stimuli or a James Bond movie. Independent component analysis (ICA) was used to identify voxels belonging to distinct functional subdivisions, based on their differential spatio-temporal fingerprints. Many more regions could be segregated during natural viewing, demonstrating that the complexity of natural stimuli leads to more differential responses in more functional modules. We demonstrate that, in a single experiment, a multitude of distinct regions can be identified across the whole brain, even within the visual cortex, including areas V1, V4 and V5. This differentiation is based entirely on the differential ATCs of different areas during natural viewing. Distinct areas can therefore be identified without any a priori hypothesis about their function or spatial location. The areas we identified corresponded anatomically across subjects, and their ATCs showed highly area-specific inter-subject correlations. Furthermore, natural conditions led to a significant de-correlation of interregional ATCs compared to rest, indicating an increase in regional specificity during natural conditions. In contrast, the correlation between ATCs of distant regions of known substantial anatomical connections increased and reflected their known anatomical connectivity pattern. We demonstrate this using the example of the language network involving Broca's and Wernicke's area and homologous areas in the two hemispheres. In conclusion, this new approach to brain mapping may not only serve to identify novel functional subdivisions, but to reveal their connectivity as well.


Figures

Figure 1
Figure 1
The colour-processing V4-complex in the human brain, revealed when subjects viewed coloured versus isochromatic stimuli in the lower or upper hemifield. (a) An IC obtained by ICA (glass brain view) containing the V4-complex in a single subject. (b) A composite image of SPM maps projected onto the ventral view of a human brain, showing colour-selective activity related to upper and lower hemifield stimulation (see inset for colour coding) (from Bartels & Zeki 2000a).
Figure 2
Figure 2
Activity related to the subjective experience of romantic love. The SPM group analysis shown in (a) revealed, among other areas, activity in a region within the anterior cingulate cortex (ac) and the middle insula (I). (b,c) ICA applied to single subjects isolated these areas in separate ICs, indicating specific ATCs in each. ATCs are shown averaged across conditions, with the blue stripe indicating the ‘love condition’. Error bars: s.e.m. See figure 4 for colour code of ICs (from Bartels & Zeki 2000b).
Figure 3
Figure 3
Attentional modulation of activity in the visual cortex. (a) Subjects fixated the middle of a screen while attending to either colour or motion in one of the four quadrants. (b,c) SPM analysis: (b) attention to different quadrants activated visual areas in a retinotopic fashion, shown as coronal glass brain views of a single subject arranged such that the one depicting attention to the top right is located in the top right, etc. (contrasts: attention to colour and motion in one quadrant versus attention to both attributes in the remaining three quadrants; p<0.05, corrected) (c) attention to colour or to motion reveals activity in V4 or in V5 (SPM contrasts: colour versus motion and vice versa). (d) ICA analysis (same subject as above): the ICs whose ATCs correlated most with the task conditions corresponded to the retinotopic attention maps shown in (b) (from Zeki & Bartels 1999; Bartels & Zeki 2000a).
Figure 4
Figure 4
Comparison of SPM with ICA and reproducibility of ICA across subjects. Upper panel: analysis of single subject data from a traditional epoch design fMRI study on motion and object recognition. (ac) The three ICs obtained by ICA whose ATCs correlated most with the stimulus conditions. They revealed differential involvement of early visual (V1/V2; a), visual motion selective (V5; b) and object selective (LOC) areas (c) in different stimulus conditions, as is apparent in the ATCs shown to their right. (df) Statistical parametric maps (SPMs; p<0.001, uncorrected) show the same cortical areas as revealed by ICA. BOLD signals taken from the most significant voxel are shown to the right of each SPM (averaged over condition repeats). Lower panel: consistent ICA results from additional four subjects of ICs containing early visual and motion selective regions. mScr, moving scramble; sObj, static object; mObj, moving object; sScr, static scramble; [all–Rest], all stimuli versus rest; [m–s], motion versus static; [Obj–Scr], objects versus scramble. Intensity maps of ICs have arbitrary units, green being neutral (i.e. no contribution to the variance). ATCs were averaged over the eight repeats of the conditions. Error bars: s.e.m. (from Bartels & Zeki 2004a).
Figure 5
Figure 5
Representative artefacts isolated by ICA from natural viewing data, together with their ATCs. (a) Eyes. ATCs reflect eye movements, which are reduced during the eight blank periods that interrupted the film. (b) Part of the ventricles. In each subject the complete ventricles were isolated, but fractionated into separate ICs, probably due to fluid flow. (c) Scanner-induced ‘spike’ affecting only one slice at one point in time. (d) Movement artefact affecting a large region on the brain's surface, with a steadily increasing signal. (e) ‘Noise’ artefact. About 30% of ICs in our analyses contained this type of noise (from Bartels & Zeki 2004a).
Figure 6
Figure 6
ICs containing visual areas obtained from a subject who freely viewed the James Bond film Tomorrow Never Dies, along with their activity time courses (ATCs). (a) Glass-brain views (sagittal and transverse maximum intensity projections, no threshold applied) of occipital ICs isolated from one subject. All regions were stimulus-driven, were also isolated in the remaining subjects and had area-specific and significant inter subject correlations of their ATCs (Bartels & Zeki 2004a). Labels indicate the presumptive identity of the regions based on their anatomical locations. The colouring of the ICs shows the relative voxel contribution, using the colour scale shown on the right, with red indicating positive contribution, green neutral/no contribution, blue negative contribution. (b) The first 3 min of the ATCs associated with each of the ICs shown in (a). Note the temporally distinct involvement of each visual region. The scale of ICA–ATCs is arbitrary and was normalized to one for each. LOp, posterior part of the lateral occipital complex; LOl, lateral part of the lateral occipital complex, V5+: V5/MT together with parts of ventral occipital cortex and presumptive V3A (modified from Bartels & Zeki 2005).
Figure 7
Figure 7
Correlogram visualizing the BOLD signal correlations between the most active voxels of the ICs shown in figure 6 during free viewing of a film. Line thickness and colour code indicate the correlation strength. Same abbreviations as in figure 6. l, left; r, right (modified from Bartels & Zeki 2005).
Figure 8
Figure 8
The same regions as shown in figure 6, superimposed onto a structural rendering of the subject's brain. Each region was identified by ICA in a separate IC, which was then colour-coded, intensity-thresholded (greater then 70% positive activation) and superimposed onto the subject's brain. Each area (IC) had an area-specific ATC that correlated significantly and selectively with anatomically corresponding areas (ICs) in the other eight subjects (see following figures). aCS, ventral lip of the anterior calcarine sulcus; Aud, auditory cortex (BA41 and 42); pc+rs, network containing precuneus (BA7) and retrosplenium (BA23 or 30); Wern, Wernicke's area (BA22) (from Bartels & Zeki 2004a).
Figure 9
Figure 9
Anatomically corresponding areas in different brains had specific and significantly correlated ATCs during free viewing of the film. Inter subject correlations of anatomically corresponding areas were in fact higher than correlations of different areas within single brains (Bartels & Zeki 2004a). Here, this is illustrated on four cortical regions (auditory cortex, V1, V5 and V4). For the first three participants in our study, the ICs as well as the ATCs of these regions are shown. Maps and traces of each individual are colour-coded. The grey bars at the top and bottom indicate blank periods (black screen, no sound), which were not considered in further analyses (from Bartels & Zeki 2004a).
Figure 10
Figure 10
Between-subject correlations of ATCs were specific to anatomically corresponding areas. For each of the 10 areas shown in figure 8, the mean inter subject correlation coefficients (r±s.e.m.) and the median inter subject ranks (rank±quartiles, normalized to 100) are shown. When, instead of anatomically corresponding areas, random areas out of the 10 (control 1: c1) or any random IC (control 2: c2) were chosen, correlations were no longer different from zero, and ranks not skewed towards zero. **p < 0.0001 (t-test on correlation coefficients.); p < 10−13 (Kolmogorov–Smirnov test on ranks). See figure 8 for abbreviations. (n): number of subjects with that area (from Bartels & Zeki 2004a).
Figure 11
Figure 11
More areas were differentially activated during free viewing than during conventional epoch stimulation. Shown are the cumulative distributions of maximal inter subject correlations among all IC-ATCs and the normalized cumulative distributions of inter subject correlations (inset) (see Bartels & Zeki 2004a). Both indicate how many ICs have ATCs that correlate across subjects and therefore provide a measure for the number of stimulus-driven regions that were differentially activated in each study. Free viewing data are shown in red and epoch data in blue. Shown in black is the expected distribution for simulated random ATCs as a baseline (white noise convolved with the haemodynamic response function; from Bartels & Zeki 2004a).
Figure 12
Figure 12
ICs and functional CMs of Wernicke's speech area and the primary auditory cortex on the example of four subjects (1–4). (a) ICs are shown colour-coded and superimposed on the subjects’ structural renderings (green: IC containing auditory cortex, red: IC containing Wernicke's area (BA22)). ICs were thresholded at 30% activity. (b,c) CMs derived from seeds taken from the hottest voxels in either BA22 or auditory cortex reveal their functional connections, which correspond to anatomical ones (modified from Bartels & Zeki 2004b, 2005).
Figure 13
Figure 13
Hierarchical functional relationships between cortical areas revealed by the correlation of their ATCs. A clustering algorithm was used to group 15 representative ICs of one subject based on the correlation coefficients matrix of their ATCs (distance measure, d=1−|r|). Branches were coloured subsequently for graphical clarity. ac, anterior cingulate; cer, cerebellum; FEF, frontal eye fields; m, motor cortex; pu, putamen (from Bartels & Zeki 2004a).
Figure 14
Figure 14
Effects of film viewing and rest periods on BOLD correlations between anatomically connected (within the language network) and non connected regions (between visual regions and language network). All correlations were calculated for within-hemispheric pairs of areas, error bars indicate ±s.e.m. (n=13 hemispheres; from Bartels & Zeki 2005). Asterisks indicate that the correlations differed with a significance of p < 0.005 for area-weighted statistics (t-test).

Similar articles

Cited by

References

    1. Bartels A, Zeki S. The architecture of the colour centre in the human visual brain: new results and a review. Eur. J. Neurosci. 2000a;12:172–193. - PubMed
    1. Bartels A, Zeki S. The neural basis of romantic love. Neuroreport. 2000b;11:3829–3834. - PubMed
    1. Bartels A, Zeki S. Functional brain mapping during free viewing of natural scenes. Hum. Brain Mapp. 2003;21:75–83. - PMC - PubMed
    1. Bartels A, Zeki S. The chronoarchitecture of the human brain—natural viewing conditions reveal a time-based anatomy of the brain. NeuroImage. 2004a;22:419–433. - PubMed
    1. Bartels A, Zeki S. The chronoarchitecture of the human brain: functional anatomy based on natural brain dynamics and the principle of functional independence. In: Frackowiak R, Friston K, Frith C, Dolan R, Zeki S, editors. Human brain function. 2nd edn. Academic Press; London: 2004b. pp. 201–229.

Publication types