

Linkage mapping of 1454 new maize candidate gene Loci
- PMID: 15937132
- PMCID: PMC1449757
- DOI: 10.1534/genetics.104.040204
Linkage mapping of 1454 new maize candidate gene Loci
Abstract
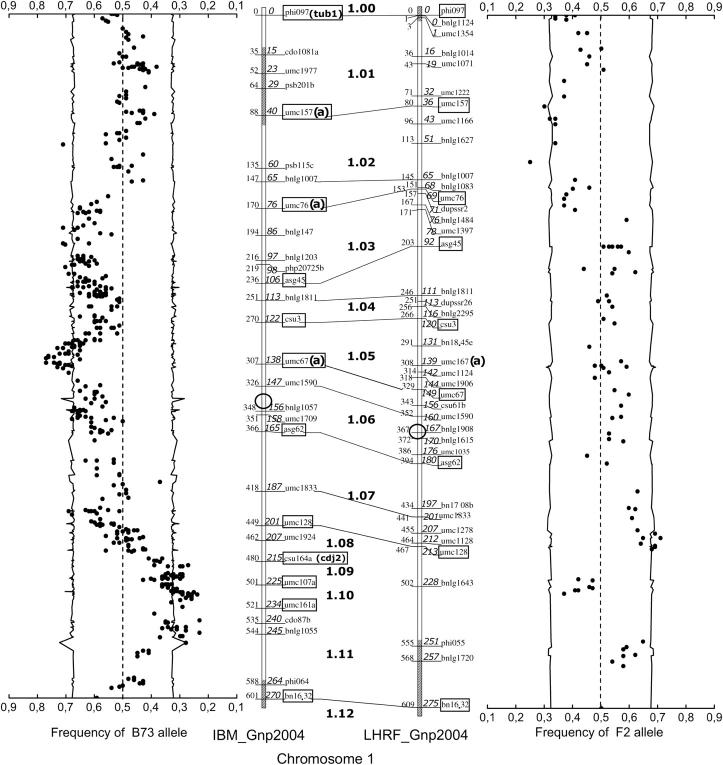
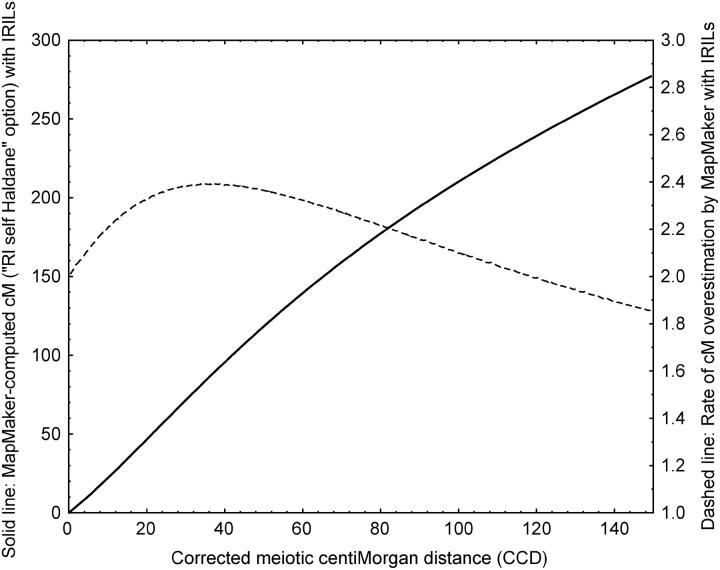
Bioinformatic analyses of maize EST sequences have highlighted large numbers of candidate genes putatively involved in agriculturally important traits. To contribute to ongoing efforts toward mapping of these genes, we used two populations of intermated recombinant inbred lines (IRILs), which allow a higher map resolution than nonintermated RILs. The first panel (IBM), derived from B73 x Mo17, is publicly available from the Maize Genetics Cooperation Stock Center. The second panel (LHRF) was developed from F2 x F252 to map loci monomorphic on IBM. We built framework maps of 237 loci from the IBM panel and 271 loci from the LHRF panel. Both maps were used to place 1454 loci (1056 on map IBM_Gnp2004 and 398 on map LHRF_Gnp2004) that corresponded to 954 cDNA probes previously unmapped. RFLP was mostly used, but PCR-based methods were also performed for some cDNAs to map SNPs. Unlike in usual IRIL-based maps published so far, corrected meiotic centimorgan distances were calculated, taking into account the number of intermating generations undergone by the IRILs. The corrected sizes of our framework maps were 1825 cM for IBM_Gnp2004 and 1862 cM for LHRF_Gnp2004. All loci mapped on LHRF_Gnp2004 were also projected on a consensus map IBMconsensus_Gnp2004. cDNA loci formed clusters near the centromeres except for chromosomes 1 and 8.
Figures

Similar articles
-
Genetic dissection of intermated recombinant inbred lines using a new genetic map of maize.Genetics. 2006 Nov;174(3):1671-83. doi: 10.1534/genetics.106.060376. Epub 2006 Sep 1. Genetics. 2006. PMID: 16951074 Free PMC article.
-
Comparison of linkage maps from F2 and three times intermated generations in two populations of European flint maize (Zea mays L.).Theor Appl Genet. 2006 Sep;113(5):857-66. doi: 10.1007/s00122-006-0343-x. Epub 2006 Jul 11. Theor Appl Genet. 2006. PMID: 16832645
-
Expanding the genetic map of maize with the intermated B73 x Mo17 (IBM) population.Plant Mol Biol. 2002 Mar-Apr;48(5-6):453-61. doi: 10.1023/a:1014893521186. Plant Mol Biol. 2002. PMID: 11999829
-
A large maize (Zea mays L.) SNP genotyping array: development and germplasm genotyping, and genetic mapping to compare with the B73 reference genome.PLoS One. 2011;6(12):e28334. doi: 10.1371/journal.pone.0028334. Epub 2011 Dec 8. PLoS One. 2011. PMID: 22174790 Free PMC article.
-
Development of pachytene FISH maps for six maize chromosomes and their integration with other maize maps for insights into genome structure variation.Chromosome Res. 2012 May;20(4):363-80. doi: 10.1007/s10577-012-9281-4. Epub 2012 May 16. Chromosome Res. 2012. PMID: 22588802 Free PMC article.
Cited by
-
SeSAM: software for automatic construction of order-robust linkage maps.BMC Bioinformatics. 2022 Nov 19;23(1):499. doi: 10.1186/s12859-022-05045-7. BMC Bioinformatics. 2022. PMID: 36402957 Free PMC article.
-
Flowering time in maize: linkage and epistasis at a major effect locus.Genetics. 2012 Apr;190(4):1547-62. doi: 10.1534/genetics.111.136903. Epub 2012 Jan 31. Genetics. 2012. PMID: 22298708 Free PMC article.
-
Major and minor QTL and epistasis contribute to fatty acid compositions and oil concentration in high-oil maize.Theor Appl Genet. 2010 Feb;120(3):665-78. doi: 10.1007/s00122-009-1184-1. Epub 2009 Oct 25. Theor Appl Genet. 2010. PMID: 19856173
-
A consensus linkage map for molecular markers and quantitative trait loci associated with economically important traits in melon (Cucumis melo L.).BMC Plant Biol. 2011 Jul 28;11:111. doi: 10.1186/1471-2229-11-111. BMC Plant Biol. 2011. PMID: 21797998 Free PMC article.
-
Precise mapping of quantitative trait loci for resistance to southern leaf blight, caused by Cochliobolus heterostrophus race O, and flowering time using advanced intercross maize lines.Genetics. 2007 May;176(1):645-57. doi: 10.1534/genetics.106.067892. Epub 2007 Mar 4. Genetics. 2007. PMID: 17339203 Free PMC article.
References
-
- Arcade, A., A. Labourdette, M. Falque, B. Mangin, F. Chardon et al., 2004. BioMercator: integrating genetic maps and QTL towards discovery of candidate genes. Bioinformatics 20: 2324–2326. - PubMed
-
- Beavis, W. D., and D. Grant, 1991. A linkage map based on information from 4 F2 populations of Maize (Zea mays L.). Theor. Appl. Genet. 82: 636–644. - PubMed
-
- Beavis, W. D., M. Lee, D. Grant, A. R. Hallauer, T. Owens et al., 1992. The influence of random mating on recombination among RFLP loci. Maize Newsl. 66: 52–53.
-
- Bernat, M., E. Titos and J. Claria, 2002. Rapid identification of single nucleotide polymorphisms by fluorescence-based capillary electrophoresis. Genet. Mol. Res. 1: 72–78. - PubMed
Publication types
MeSH terms
Substances
LinkOut - more resources
Full Text Sources
Other Literature Sources
Research Materials
Miscellaneous
