Comparative Study
. 2005 Aug;170(4):1929-44.
doi: 10.1534/genetics.104.034454. Epub 2005 Jun 3.

Cis-effects on meiotic recombination across distinct a1-sh2 intervals in a common Zea genetic background

Affiliations
Comparative Study

Cis-effects on meiotic recombination across distinct a1-sh2 intervals in a common Zea genetic background

Hong Yao et al. Genetics. 2005 Aug.

Abstract

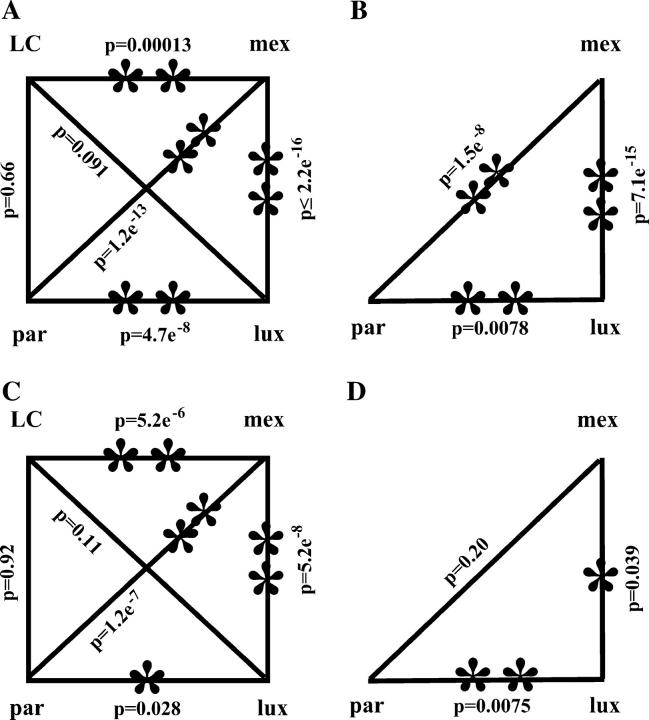
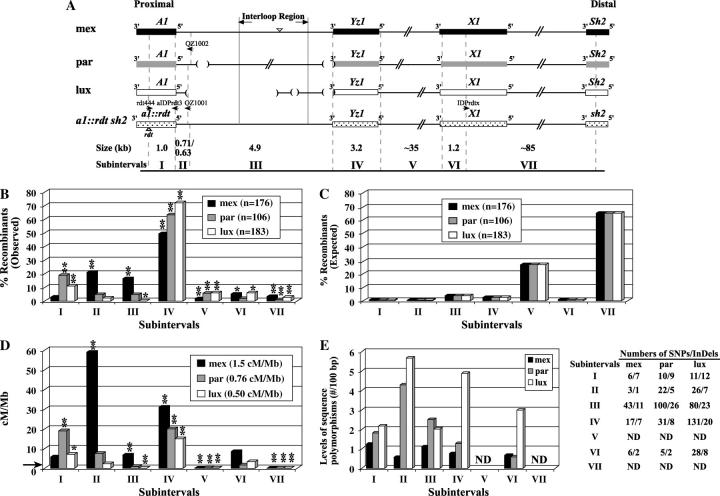
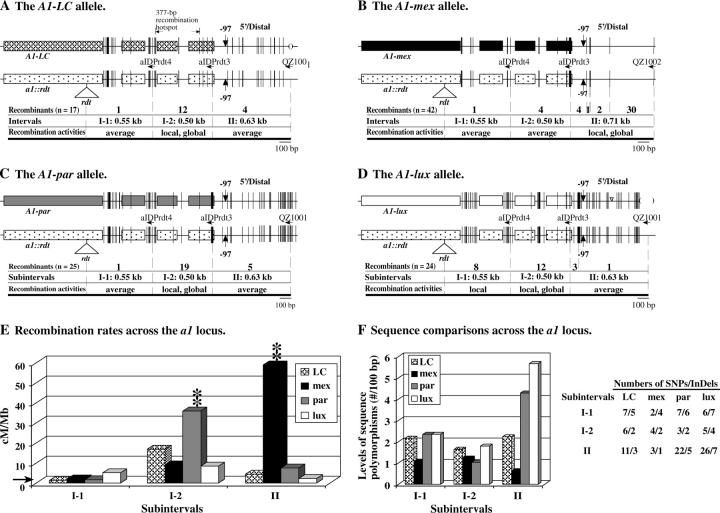
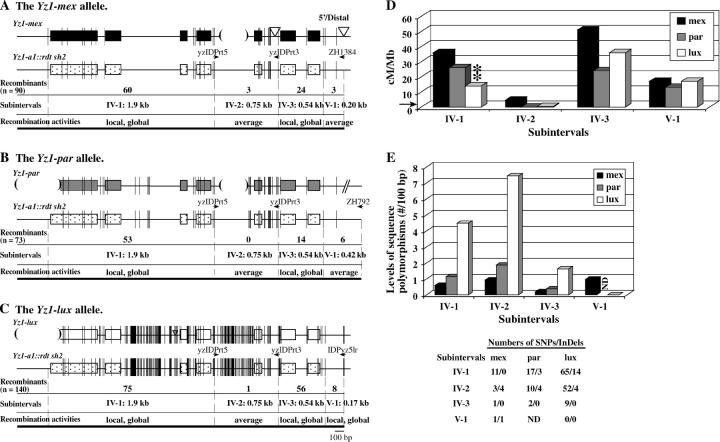
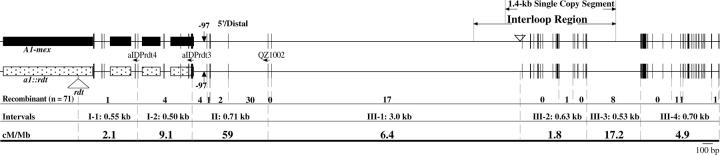
Genetic distances across the a1-sh2 interval varied threefold in three near-isogenic stocks that carry structurally distinct teosinte A1 Sh2 haplotypes (from Z. mays spp. mexicana Chalco, Z. mays spp. parviglumis, and Z. luxurians) and a common maize a1::rdt sh2 haplotype. In each haplotype >85% of recombination events resolved in the proximal 10% of the approximately 130-kb a1-sh2 interval. Even so, significant differences in the distributions of recombination breakpoints were observed across subintervals among haplotypes. Each of the three previously detected recombination hot spots was detected in at least one of the three teosinte haplotypes and two of these hot spots were not detected in at least one teosinte haplotype. Moreover, novel hot spots were detected in two teosinte haplotypes. Due to the near-isogenic nature of the three stocks, the observed variation in the distribution of recombination events is the consequence of cis-modifications. Although generally negatively correlated with rates of recombination per megabase, levels of sequence polymorphisms do not fully account for the nonrandom distribution of recombination breakpoints. This study also suggests that estimates of linkage disequilibrium must be interpreted with caution when considering whether a gene has been under selection.


Figures

F<sc>igure</sc> 1.—
Figure 1.—
Comparisons of recombination rates per megabase and distributions of recombination breakpoints among stocks that carry different A1 Sh2 haplotypes. (A) Rates of recombination per megabase between the al and sh2 loci. (B) Distributions of recombination breakpoints across the al-sh2 interval. (C) Distributions of recombination breakpoints across the a1 locus (subintervals I–II). (D) Distributions of recombination breakpoints across the yz1 locus (subinterval IV). Rates and distributions were compared via χ2 tests and P-values are indicated. Statistically significant differences are indicated by asterisks. (*) Significant difference at the 0.05 level; (**) significant difference at the 0.01 level. Although the LC haplotype in A and C are identical by descent, they were analyzed in different genetic stocks (A, LC2; C, LC1; materials and methods). Comparisons in D did not include recombinants that resolved in subinterval V-1 (Figure 4) because the sizes of this subinterval vary too much among haplotypes to permit fair comparisons. The distribution of breakpoints across the yz1 gene considered only the transcribed region (subinterval IV).
F<sc>igure</sc> 2.—
Figure 2.—
Distributions of recombination events and sequence polymorphisms across the a1-sh2 intervals of the mex, par, and lux haplotypes. (A) Comparisons of the structures of the three teosinte A1 Sh2 haplotypes relative to the maize a1::rdt sh2 haplotype. Genes are indicated as boxes. The polymorphisms shared by teosinte haplotypes relative to the a1::rdt sh2 haplotype that were used to define the subintervals are indicated by shaded dashed lines. Subintervals I, II, IV, and VI were completely sequenced for all haplotypes. Subinterval III was completely sequenced for the mex, lux, and a1::rdt sh2 haplotypes and partially sequenced for the par haplotype. Large InDeLs in subinterval III are indicated by triangles (insertions) and parentheses (deletions). The rdt transposon insertion is indicated by a triangle. Large InDeLs in other subintervals are not shown. Haplotype-specific IDP primers used to map recombination breakpoints are indicated by horizontal arrows. The sizes of each subinterval are based on those of the a1::rdt sh2 haplotype that is common among stocks carrying the mex, par, and lux haplotypes. Because no sequence polymorphisms are shared by all three haplotypes at the distal ends of subintervals II, the size of subinterval II-mex (0.71 kb) differs slightly from the sizes of subintervals II-par and II-lux (0.63 kb). Figure not to scale. (B) Observed percentages of recombinants that resolved in each subinterval. (*) and (**) indicate significant differences between the rates of recombination per megabase based on the observed recombination breakpoints mapped to subintervals and the corresponding average rates per megabase across the a1-sh2 interval of each haplotype at the 0.05 and 0.01 levels, respectively. (C) Percentages of recombinants expected to resolve in each subinterval based on a random distribution across the a1-sh2 interval. (D) Recombination rates per megabase in subintervals. The indicated average rates of recombination per megabase across the a1-sh2 interval in each of the three stocks were calculated on the basis of the physical size (∼130 kb) of the common a1::rdt sh2 haplotype carried in all stocks. The horizontal arrow indicates the average recombination rate per megabase of the maize genome (2.1 cM/Mb). (E) Levels of sequence polymorphisms (no./100 bp) between each A1 Sh2 haplotype and the a1::rdt sh2 haplotype. Numbers of SNPs/InDeLs in each subinterval are presented. Values for subinterval III-par were calculated using only the sequenced portions of this subinterval. ND, not determined.
F<sc>igure</sc> 3.—
Figure 3.—
High-resolution mapping of the recombination breakpoints that resolved in the a1 locus of the LC, mex, par, and lux haplotypes. (A–D) Exons of the a1 gene are shown as boxes. Short vertical lines represent sequence polymorphisms between A1 alleles and the a1::rdt allele. The widths of the vertical lines are proportional to the numbers of polymorphic nucleotides. Subintervals are defined by sequence polymorphisms. Haplotype-specific primers are indicated by horizontal arrows. The numbers of recombination breakpoints that mapped to each subinterval for each haplotype are shown. Each interval is classified as being an average recombination spot (average), a local recombination hot spot (local), or a local and global recombination hot spot (local, global; see legend of Table 3 for definitions). Large InDeLs are indicated by triangles (insertions) and parentheses (deletions). (A) The positions of recombination breakpoints previously characterized by Yao et al. (2002), but here classified relative to subintervals I-1 and I-2. (E) Comparison of recombination rates per megabase across the a1 locus among the LC, mex, par, and lux haplotypes. The horizontal arrow indicates the average recombination rate per megabase of the maize genome (2.1 cM/Mb). (**) indicates that the recombination rate per megabase in the labeled haplotype in the corresponding subinterval is significantly different from all others at the 0.01 level. (F) Comparison of levels of sequence polymorphisms (no./100 bp) at the a1 locus among the LC, mex, par, and lux haplotypes. Sequence polymorphisms are between each A1 Sh2 haplotype and the a1::rdt sh2 haplotype. Numbers of SNPs/InDeLs in each subinterval are also listed.
F<sc>igure</sc> 4.—
Figure 4.—
High-resolution mapping of the recombination breakpoints that resolved in the yz1 locus in the mex, par, and lux haplotypes. (A–C) Exons of the yz1 gene are shown as boxes. Short vertical lines represent sequence polymorphisms between each teosinte Yz1 allele and the Yz1 allele from the a1::rdt sh2 stock. The widths of these short vertical lines are proportional to the numbers of polymorphic nucleotides. Subintervals are defined by sequence polymorphisms. Haplotype-specific primers are indicated by horizontal arrows. The numbers of recombination breakpoints that mapped to each subinterval are shown for each haplotype. Each interval is classified as being an average recombination spot (average), a local recombination hot spot (local), or a local and global recombination hot spot (local, global; see legend of Table 3 for definitions). Large InDeLs are indicated by triangles (insertions) and parentheses (deletions). (D) Comparison of recombination rates per megabase across the yz1 locus among the mex, par, and lux haplotypes. The horizontal arrow indicates the average recombination rate per megabase of the maize genome (2.1 cM/Mb). (**) indicates that the recombination rate per megabase in the labeled haplotype at the corresponding subinterval is significantly different from the others at the 0.01 level. (E) Comparison of the levels of sequence polymorphisms (no./100 bp) at the yz1 locus among the mex, par, and lux haplotypes. Numbers of sequence polymorphisms were calculated by comparing each of the teosinte Yz1 alleles and the common Yz1 allele from the a1::rtdt sh2 stock. Numbers of SNPs/InDeLs in each of the subintervals are listed.
F<sc>igure</sc> 5.—
Figure 5.—
Recombination breakpoints across the a1-interloop region of the mex haplotype. Exons of the a1 gene are shown as boxes. Short vertical lines represent sequence polymorphisms between the mex A1 Sh2 haplotype and the a1::rdt sh2 haplotype. The widths of the vertical lines are proportional to the numbers of polymorphic nucleotides. Subintervals are defined by sequence polymorphisms. Subinterval III-1 is not drawn to scale. Haplotype-specific primers are indicated by horizontal arrows. The numbers of recombination breakpoints that mapped to each subinterval are shown. Large InDeLs are indicated by triangles.

Similar articles

Cited by

References

    1. Allers, T., and M. Lichten, 2001. Differential timing and control of noncrossover and crossover recombination during meiosis. Cell 106: 47–57. - PubMed
    1. Arumuganathan, K., and E. D. Earle, 1991. Nuclear DNA content of some important plant species. Plant Mol. Biol. Rep. 9: 208–218.
    1. Borts, R. H., W. Y. Leung, W. Kramer, B. Kramer, M. Williamson et al., 1990. Mismatch repair-induced meiotic recombination requires the pms1 gene product. Genetics 124: 573–584. - PMC - PubMed
    1. Borts, R. H., S. R. Chambers and M. F. Abdullah, 2000. The many faces of mismatch repair in meiosis. Mutat. Res. 451: 129–150. - PubMed
    1. Brown, J. J., G. Mattes, C. O'Reilly and N. S. Shepherd, 1989. Molecular characterization of rDt, a maize transposon of the “Dotted” controlling element system. Mol. Gen. Genet. 215: 239–244. - PubMed

Publication types