

The aggregation kinetics of Alzheimer's beta-amyloid peptide is controlled by stochastic nucleation
- PMID: 15937275
- PMCID: PMC2253354
- DOI: 10.1110/ps.041266605
The aggregation kinetics of Alzheimer's beta-amyloid peptide is controlled by stochastic nucleation
Abstract
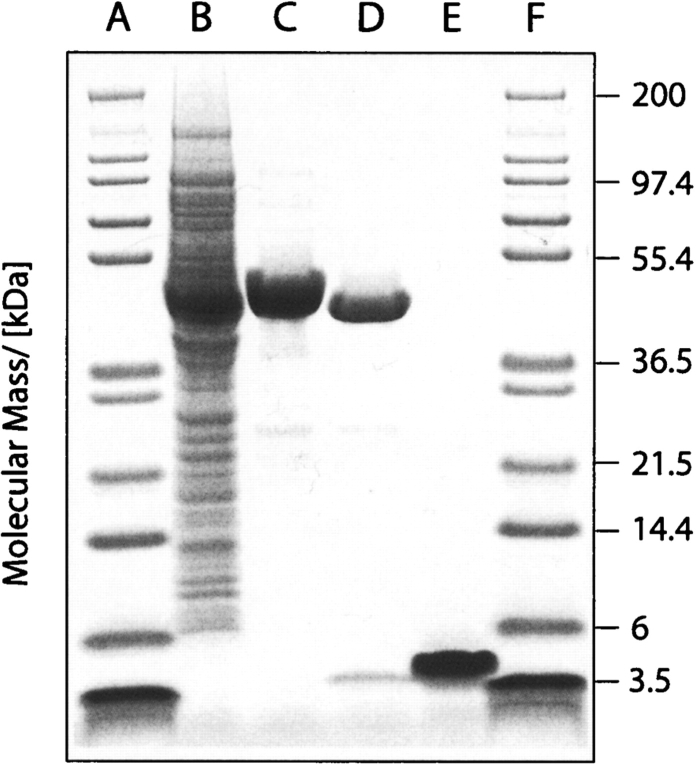
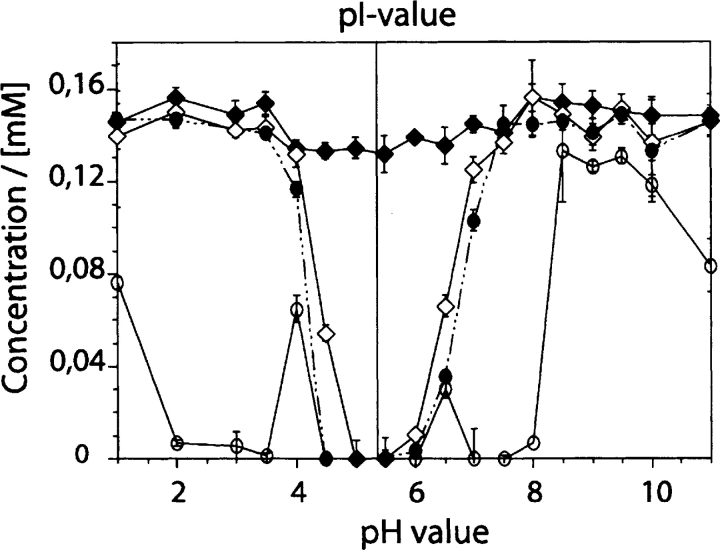
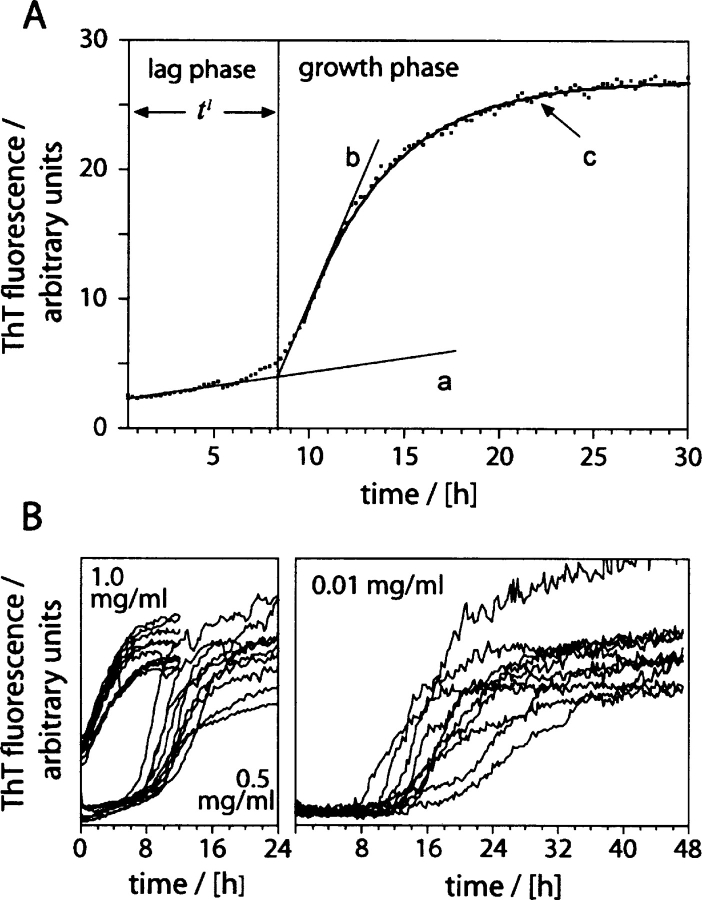
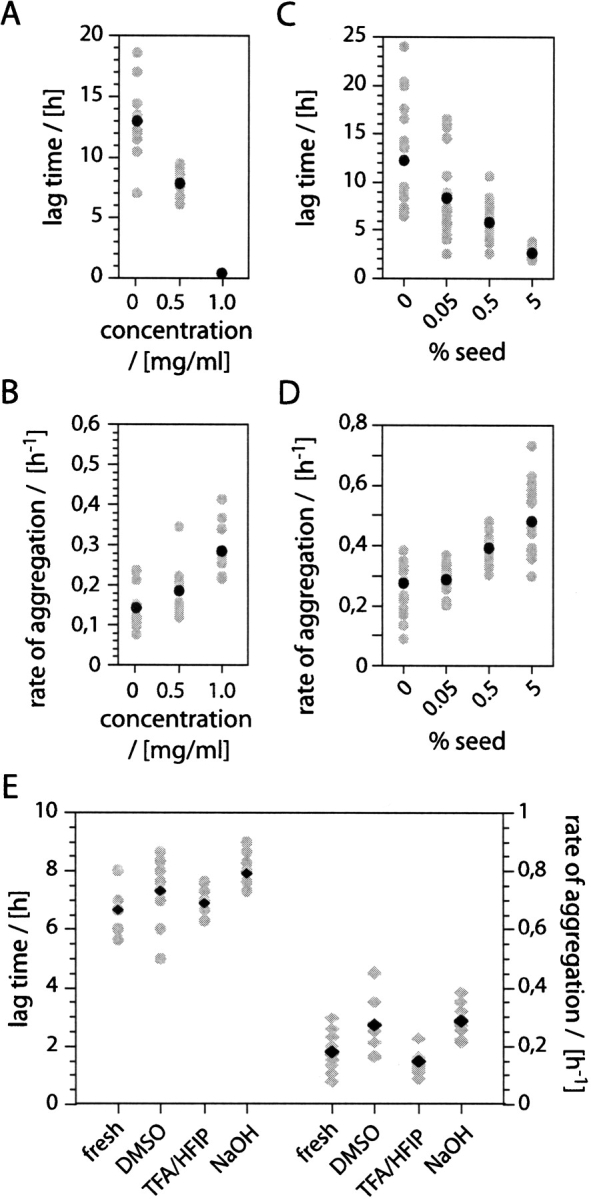
We report here a recombinant expression system that allows production of large quantities of Alzheimer's Abeta(1-40) peptide. The material is competent to dissolve in water solutions with "random-coil properties," although its conformation and factual oligomerization state are determined by the physico-chemical solution conditions. When dissolved in 50 mM sodium phosphate buffer (pH 7.4) at 37 degrees C, the peptide is able to undergo a nucleated polymerization reaction. The aggregation profile is characteristically bipartite, consisting of lag and growth phase. From these curves we determined the lag time as well as the rate of aggregation. Both values were found to depend on peptide concentration and addition or formation of seeds. Moreover, they can vary considerably between apparently identical samples. These data imply that the nucleation event is under influence of a stochastic factor that can manifest itself in profound macroscopic differences in the aggregation kinetics of otherwise indistinguishable samples.
Figures

Similar articles
-
Mutagenic analysis of the nucleation propensity of oxidized Alzheimer's beta-amyloid peptide.Protein Sci. 2005 Aug;14(8):2125-31. doi: 10.1110/ps.051470405. Epub 2005 Jun 29. Protein Sci. 2005. PMID: 15987892 Free PMC article.
-
DHPC strongly affects the structure and oligomerization propensity of Alzheimer's Aβ(1-40) peptide.J Mol Biol. 2010 Nov 5;403(4):643-59. doi: 10.1016/j.jmb.2010.09.021. Epub 2010 Sep 17. J Mol Biol. 2010. PMID: 20851128
-
Bacterial inclusion bodies of Alzheimer's disease β-amyloid peptides can be employed to study native-like aggregation intermediate states.Chembiochem. 2011 Feb 11;12(3):407-23. doi: 10.1002/cbic.201000602. Epub 2011 Jan 10. Chembiochem. 2011. PMID: 21290543
-
A routine method for cloning, expressing and purifying Aβ(1-42) for structural NMR studies.Amino Acids. 2014 Oct;46(10):2415-26. doi: 10.1007/s00726-014-1796-x. Epub 2014 Jul 16. Amino Acids. 2014. PMID: 25027618
-
In vitro oligomerization and fibrillogenesis of amyloid-beta peptides.Subcell Biochem. 2012;65:53-74. doi: 10.1007/978-94-007-5416-4_3. Subcell Biochem. 2012. PMID: 23224999 Review.
Cited by
-
pH Dependence of Amyloid-β Fibril Assembly Kinetics: Unravelling the Microscopic Molecular Processes.Angew Chem Int Ed Engl. 2022 Nov 25;61(48):e202210675. doi: 10.1002/anie.202210675. Epub 2022 Oct 27. Angew Chem Int Ed Engl. 2022. PMID: 36197009 Free PMC article.
-
On the stability of the soluble amyloid aggregates.Biophys J. 2009 Sep 2;97(5):1454-60. doi: 10.1016/j.bpj.2009.05.055. Biophys J. 2009. PMID: 19720034 Free PMC article.
-
A long-lived Aβ oligomer resistant to fibrillization.Biopolymers. 2018 Aug;109(8):e23096. doi: 10.1002/bip.23096. Epub 2018 Jan 10. Biopolymers. 2018. PMID: 29319162 Free PMC article.
-
Amyloidogenesis via interfacial shear in a containerless biochemical reactor aboard the International Space Station.NPJ Microgravity. 2022 Sep 20;8(1):41. doi: 10.1038/s41526-022-00227-2. NPJ Microgravity. 2022. PMID: 36127358 Free PMC article.
-
Highly potent intracellular membrane-associated Aβ seeds.Sci Rep. 2016 Jun 17;6:28125. doi: 10.1038/srep28125. Sci Rep. 2016. PMID: 27311744 Free PMC article.
References
-
- Arvinte, T., Cudd, A., and Drake, A.F. 1993. The structure and mechanism of formation of human calcitonin fibrils. J. Biol. Chem. 268 6415–6422. - PubMed
-
- Caughey, B. and Lansbury, P.T. 2003. Protofibrils, pores, fibrils, and neurodegeneration: Separating the responsible protein aggregates from the innocent bystanders. Annu. Rev. Neurosci. 26 267–298. - PubMed
-
- Chiti, F., Taddei, N., Baroni, F., Capanni, C., Stefani, M., Ramponi, G., and Dobson, C.M. 2002. Kinetic partitioning of protein folding and aggregation. Nat. Struct. Biol. 9 137–143. - PubMed
Publication types
MeSH terms
Substances
LinkOut - more resources
Full Text Sources
Other Literature Sources
