Urea-induced denaturation of apolipoprotein serum amyloid A reveals marginal stability of hexamer
- PMID: 15937280
- PMCID: PMC2253367
- DOI: 10.1110/ps.051387005
Urea-induced denaturation of apolipoprotein serum amyloid A reveals marginal stability of hexamer
Abstract
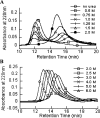
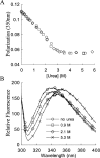
Serum Amyloid A (SAA) is an acute phase reactant protein that is predominantly found bound to high-density lipoprotein in plasma. Upon inflammation, the plasma concentration of SAA can increase dramatically, occasionally leading to the development of amyloid A (AA) amyloidosis, which involves the deposition of SAA amyloid fibrils in major organs. We previously found that the murine isoform SAA2.2 exists in aqueous solution as a hexamer containing a central channel. Here we show using various biophysical and biochemical techniques that the SAA2.2 hexamer can be totally dissociated into monomer by approximately 2 M urea, with the concerted loss of its alpha-helical structure. However, limited trypsin proteolysis experiments in urea showed a conserved digestion profile, suggesting the preservation of major backbone topological features in the urea-denatured state of SAA2.2. The marginal stability of hexameric SAA2.2 and the presence of residual structure in the denatured monomeric protein suggest that both forms may interconvert in vivo to exert different functions to meet the various needs during normal physiological conditions and in response to inflammatory stimuli.
Figures


Similar articles
-
Murine apolipoprotein serum amyloid A in solution forms a hexamer containing a central channel.Proc Natl Acad Sci U S A. 2002 Dec 10;99(25):15947-52. doi: 10.1073/pnas.252508399. Epub 2002 Nov 27. Proc Natl Acad Sci U S A. 2002. PMID: 12456883 Free PMC article.
-
From hexamer to amyloid: marginal stability of apolipoprotein SAA2.2 leads to in vitro fibril formation at physiological temperature.Amyloid. 2005 Sep;12(3):139-48. doi: 10.1080/13506120500223084. Amyloid. 2005. PMID: 16194868
-
Effect of zinc, copper, and calcium on the structure and stability of serum amyloid A.Biochemistry. 2007 May 8;46(18):5562-9. doi: 10.1021/bi602629y. Epub 2007 Apr 11. Biochemistry. 2007. PMID: 17425332
-
Intrinsic Stability, Oligomerization, and Amyloidogenicity of HDL-Free Serum Amyloid A.Adv Exp Med Biol. 2015;855:117-34. doi: 10.1007/978-3-319-17344-3_5. Adv Exp Med Biol. 2015. PMID: 26149928 Review.
-
Structural Basis for Vital Function and Malfunction of Serum Amyloid A: an Acute-Phase Protein that Wears Hydrophobicity on Its Sleeve.Curr Atheroscler Rep. 2020 Sep 24;22(11):69. doi: 10.1007/s11883-020-00888-y. Curr Atheroscler Rep. 2020. PMID: 32968930 Free PMC article. Review.
Cited by
-
Colocalization of serum amyloid a with microtubules in human coronary artery endothelial cells.J Biomed Biotechnol. 2011;2011:528276. doi: 10.1155/2011/528276. Epub 2011 Oct 27. J Biomed Biotechnol. 2011. PMID: 22131810 Free PMC article.
-
Characterization of the oligomerization and aggregation of human Serum Amyloid A.PLoS One. 2013 Jun 4;8(6):e64974. doi: 10.1371/journal.pone.0064974. Print 2013. PLoS One. 2013. PMID: 23750222 Free PMC article.
-
Divergent effect of glycosaminoglycans on the in vitro aggregation of serum amyloid A.Biochimie. 2014 Sep;104:70-80. doi: 10.1016/j.biochi.2014.05.007. Epub 2014 May 28. Biochimie. 2014. PMID: 24878279 Free PMC article.
-
Interleukin-1β Induces Intracellular Serum Amyloid A1 Expression in Human Coronary Artery Endothelial Cells and Promotes its Intercellular Exchange.Inflammation. 2019 Aug;42(4):1413-1425. doi: 10.1007/s10753-019-01003-3. Inflammation. 2019. PMID: 31011929
-
Diabetes mellitus drug discovery: insights into targeting feline and human amylin with small molecules.Vet Q. 2023 Dec;43(1):1-12. doi: 10.1080/01652176.2023.2260442. Epub 2023 Oct 4. Vet Q. 2023. PMID: 37729105 Free PMC article.
References
-
- Ancsin, J.B. and Kisilevsky, R. 1999a. The heparin/heparan sulfate-binding site on apo-serum amyloid A. Implications for the therapeutic intervention of amyloidosis. J. Biol. Chem. 274 7172–7181. - PubMed
-
- ———. 1999b. Laminin interactions with the apoproteins of acute-phase HDL: Preliminary mapping of the laminin binding site on serum amyloid A. Amyloid 6 37–47. - PubMed
-
- Checovich, W.J., Bolger, R.E., and Burke, T. 1995. Fluorescence polarization —A new tool for cell and molecular biology. Nature 375 254–256. - PubMed
-
- Colón, W. 1999. Analysis of protein structure by solution optical spectroscopy. Methods Enzymol. 309 605–632. - PubMed
Publication types
MeSH terms
Substances
Grants and funding
LinkOut - more resources
Full Text Sources
Miscellaneous

