. 2005 Jun 6;169(5):733-43.
doi: 10.1083/jcb.200502062.

Methyl CpG-binding proteins induce large-scale chromatin reorganization during terminal differentiation

Affiliations

Methyl CpG-binding proteins induce large-scale chromatin reorganization during terminal differentiation

Alessandro Brero et al. J Cell Biol. .

Abstract

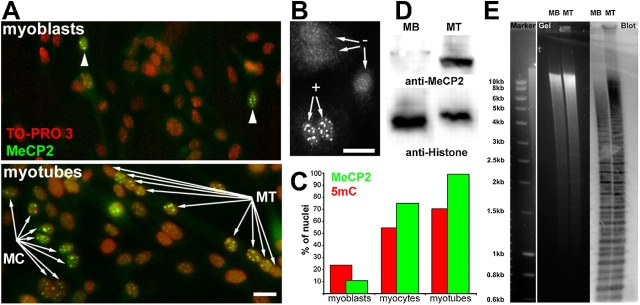
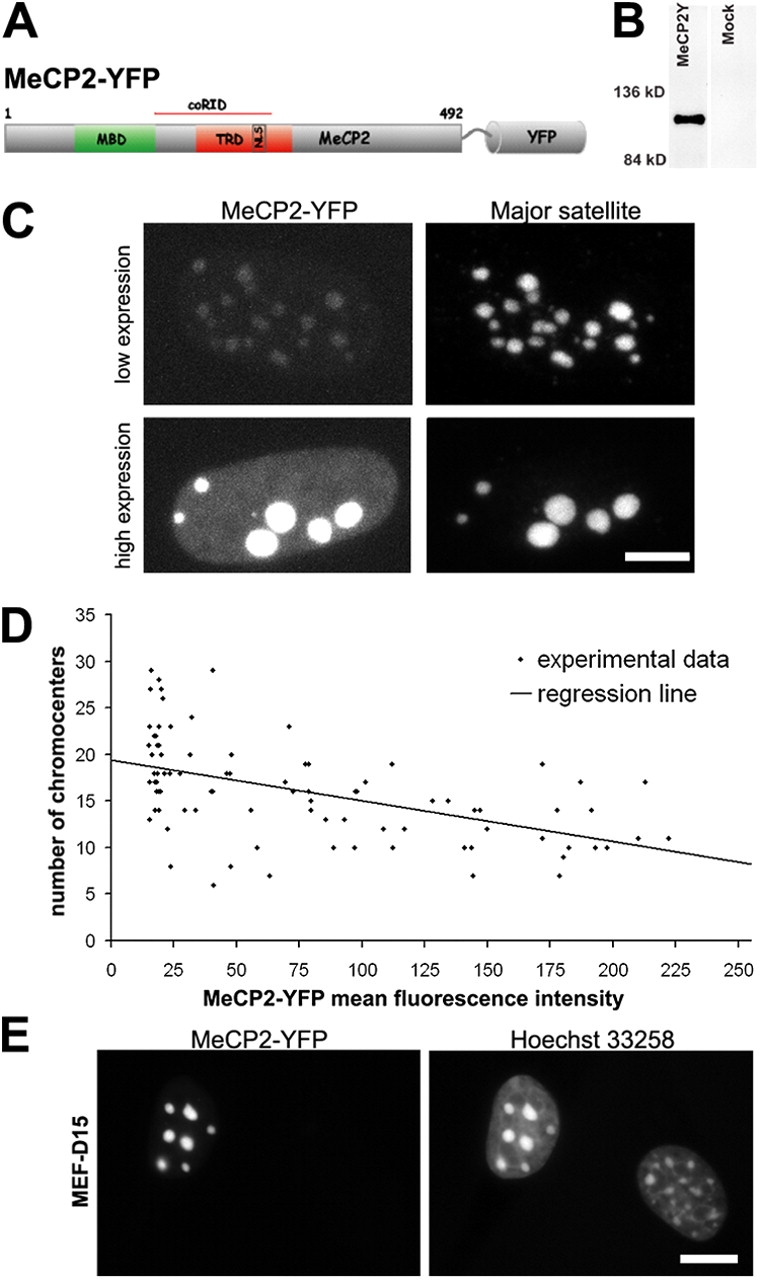
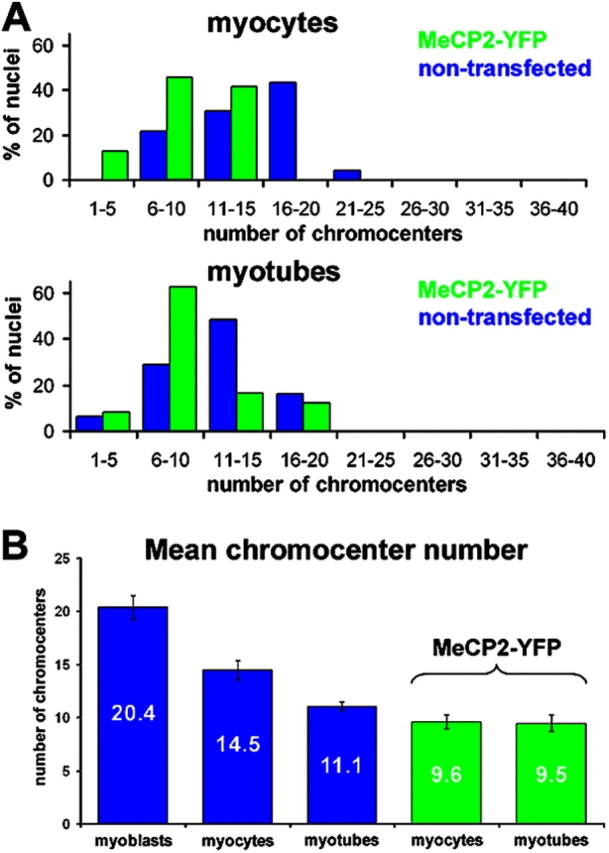
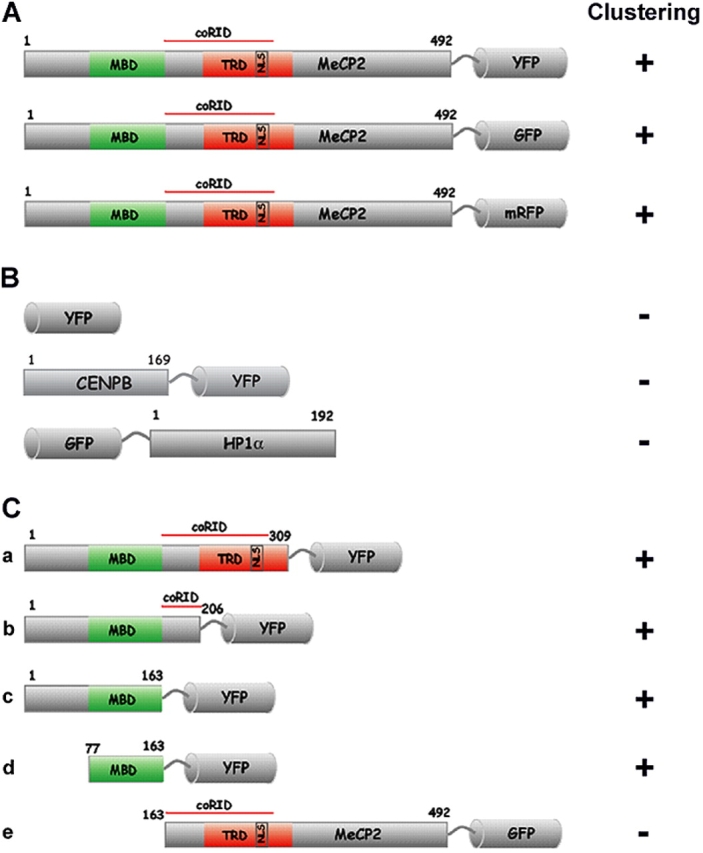
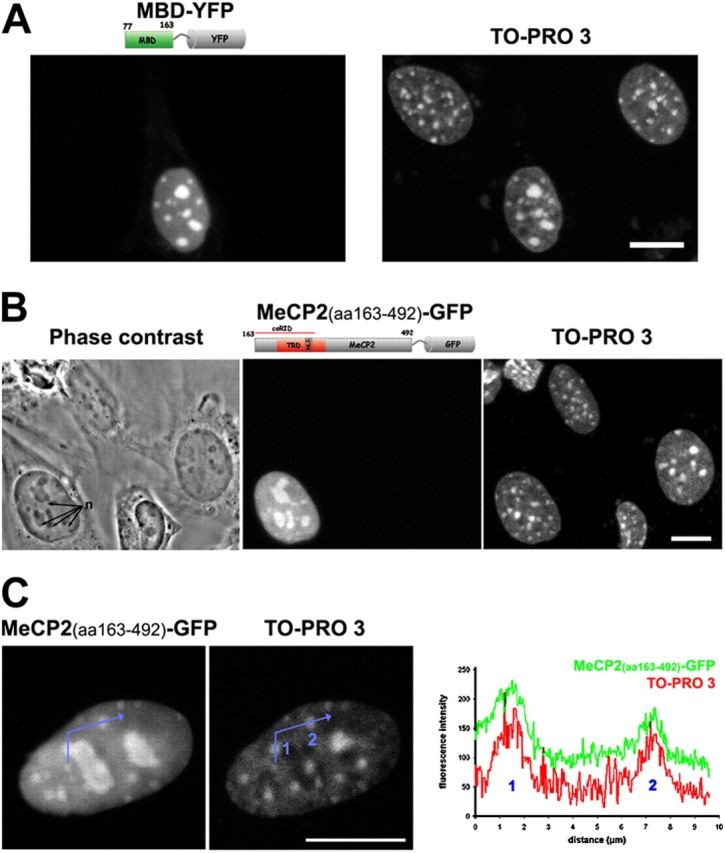
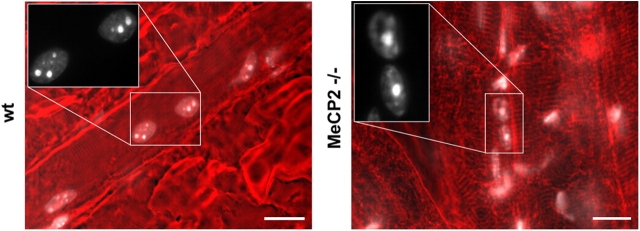
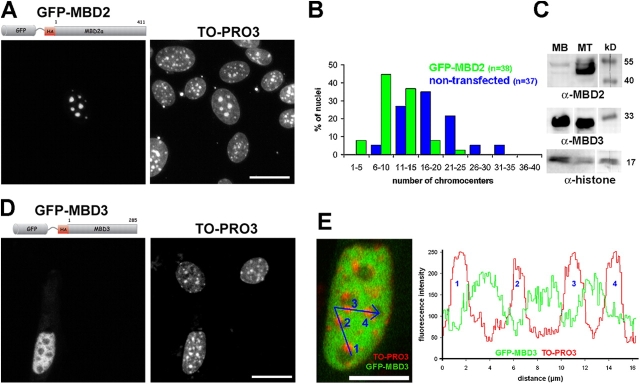
Pericentric heterochromatin plays an important role in epigenetic gene regulation. We show that pericentric heterochromatin aggregates during myogenic differentiation. This clustering leads to the formation of large chromocenters and correlates with increased levels of the methyl CpG-binding protein MeCP2 and pericentric DNA methylation. Ectopic expression of fluorescently tagged MeCP2 mimicked this effect, causing a dose-dependent clustering of chromocenters in the absence of differentiation. MeCP2-induced rearrangement of heterochromatin occurred throughout interphase, did not depend on the H3K9 histone methylation pathway, and required the methyl CpG-binding domain (MBD) only. Similar to MeCP2, another methyl CpG-binding protein, MBD2, also increased during myogenic differentiation and could induce clustering of pericentric regions, arguing for functional redundancy. This MeCP2- and MBD2-mediated chromatin reorganization may thus represent a molecular link between nuclear genome topology and the epigenetic maintenance of cellular differentiation.


Figures

Figure 1.
Figure 1.
MeCP2 level increases during myogenesis and is paralleled by an increased methylation of pericentric DNA. (A) Undifferentiated and differentiated Pmi28 cultures were immunolabeled for MeCP2 (green) and counterstained with TO-PRO3 (red). Panels in A show two equally sized areas of an undifferentiated myoblast culture (top) and of a culture 3 d after induction of differentiation (bottom). Although in the myoblast culture only two cells show MeCP2 staining (arrowheads), in the differentiated culture many myocytes (MC) and almost all myotube nuclei (MT) are stained (arrows). Bar, 20 μm. 230 myoblast, 220 myocyte, and 214 myotube nuclei were scored for detectable MeCP2 signals. B exemplifies the scoring on five myocyte nuclei: three nuclei show no detectable MeCP2 signals (−), whereas two exhibit the characteristic MeCP2 pattern (+) with most of the protein being localized at pericentric heterochromatin. Bar, 20 μm. (C) The histogram summarizes the quantification of detectable MeCP2 signals and of highly methylated DNA in pericentric regions of myoblast, myocytes, and myotubes. DNA methylation was assessed using an mAb against 5-methyl-cytosine (5mC). Scoring was performed as for MeCP2. (D) A Western blot analysis comparing endogenous protein levels of MeCP2 in C2C12 myoblasts versus myotubes. Histone level was used as control for loading of nuclear proteins. (E) Southern blot analysis of genomic DNA from myoblasts (MB) versus myotubes (MT) digested with the methylation-sensitive restriction enzyme HpyCH4 IV (5′-ACGT-3′). Digested DNA was probed with a major satellite-specific probe. Note the higher concentration of undigested high molecular weight DNA in the myotube sample, indicating an increased methylation level.
Figure 2.
Figure 2.
Clustering of pericentric heterochromatin increases during myogenesis. The histogram shows the number of chromocenters plotted versus the percentage of nuclei within populations of terminally differentiated myotubes (blue columns) and myoblasts (red columns). For each cell type, a 3D reconstruction of the TO-PRO3 nuclear counterstaining (red) and of pericentric heterochromatin labeled by a mouse major satellite-specific probe (green) is shown.
Figure 3.
Figure 3.
MeCP2-YFP overexpression induces clustering of pericentric heterochromatin, which is independent of the histone H3 methylation pathway. Pmi28 myoblasts growing on etched coverslips were transiently transfected with an MeCP2-YFP expression vector. Confocal image stacks of 86 nuclei with different expression levels were recorded using constant image acquisition parameters and their mean fluorescence intensity was calculated. After post-fixation and FISH using a major satellite-specific probe, pre-recorded nuclei were re-recorded to determine the number of chromocenters. (A) Rat MeCP2-YFP fusion protein and its functional domains (MBD, methyl CpG–binding domain; NLS, nuclear localization signal; TRD, transcriptional repression domain; coRID, corepressor interacting domain; numbers indicate amino acid positions). (B) Western blot with an anti-GFP antibody verifying expression of the fusion protein in transfected cells. (C) Images represent maximum intensity projections from confocal stacks of Pmi28 myoblasts expressing different levels of MeCP2-YFP. Bar, 5 μm. (D) The graph illustrates the results of the correlation analysis. The linear equation for the regression line was calculated as y = −0.04 × 19.41. Panels in E show MEF-D15 suv39h1/2 double-null mouse fibroblasts transfected with MeCP2-YFP. Bar, 10 μm.
Figure 4.
Figure 4.
Fusion of chromocenters occurs throughout interphase. C2C12 myoblasts were double transfected with MeCP2-YFP and DsRed-Ligase I to track cell cycle progression. Schematic diagrams of the fusion proteins are depicted in A. (B) Maximum intensity projections generated from confocal image stacks of four time points of an MeCP2-YFP–transfected myoblast are shown (full time-lapse in Video 1, available at http://www.jcb.org/cgi/content/full/jcb.200502062/DC1). MeCP2-YFP is shown in green, phase-contrast images are in red. (C) As apparent from the DsRed-Ligase I replication pattern, this cell was in late S-phase and moved into G2 after 3 h. In B, the last 180 min from the time series are shown. Three fusion events are highlighted in different colors (yellow, white, and black). The time points where the actual fusions take place are marked by an asterisk and were analyzed in all three dimensions. Most observed fusions included very close chromocenters, but as in the case highlighted in yellow it could also affect chromocenters located >2 μm apart. Bar (B and C), 5 μm. The table in D summarizes the analysis from 14 time series. In 9 of these cells chromocenter fusions occurred.
Figure 5.
Figure 5.
Increased clustering during myogenic differentiation is enhanced by high MeCP2-YFP expression. (A) The number of chromocenters in nontransfected Pmi28 myocytes and myotubes (blue columns) was compared with that in transfected Pmi28 myocytes and myotubes, which showed a substantial overexpression of MeCP2-YFP (green columns). In transfected cells, a clear shift toward a smaller number of clusters is evident. This effect is also visible if the mean number of chromocenters is compared (B). Myocytes, which represent an intermediate differentiation state between myoblasts and myotubes show also an intermediate number of chromocenters in nontransfected cells (blue). Error bars indicate SEM.
Figure 6.
Figure 6.
The MBD is sufficient and necessary to induce clustering of pericentric heterochromatin I. The sketch shows the structure of various fusion proteins that were expressed in mouse myoblasts in order to test for their clustering potential. + and − indicate whether or not an increased aggregation of pericentric heterochromatin could be observed in cells that showed high levels of the respective fusion protein. (A) Induced clustering by high MeCP2 expression could be observed irrespective of whether YFP, GFP, or the nonrelated DsRed derivative mRFP was used as a fluorescent tag. (B) Neither YFP alone nor the DNA-binding domain of the centromeric protein CENPB nor the pericentric heterochromatin protein HP1α appeared to induce clustering of pericentric regions (see also Fig. S2, available at http://www.jcb.org/cgi/content/full/jcb.200502062/DC1). (C) Truncated MeCP2 fusion proteins with increasing deletions of the COOH terminus (a–c) including the transcriptional repressor domain (TRD) and the corepressor interacting domain (coRID) were still able to induce chromocenter clustering. Clustering was even observed for a deletion mutant containing the MBD only (d). High level expression of an MeCP2 fusion protein lacking the NH2 terminus including the MBD had no clustering effect (e), arguing that the MBD is necessary and sufficient for the induction of heterochromatin aggregation.
Figure 7.
Figure 7.
The MBD is sufficient and necessary to induce clustering of pericentric heterochromatin II. Pmi28 mouse myoblasts were transfected with several MeCP2 deletion mutants tagged with YFP or GFP. In the examples shown, cells were transfected with a vector containing only the MBD of MeCP2 fused to YFP (A), or with an MeCP2-GFP fusion lacking the first 162 amino acids including the MBD (B and C). A and B represent maximum intensity projections of confocal image stacks, except for the phase-contrast image, which is a mid-section. (C) Two mid-confocal sections. Bars, 10 μm. (A) Note that the cell expressing high levels of MBD-YFP exhibits a more pronounced clustering of chromocenters compared with nonexpressing cells, as revealed by TO-PRO 3 staining. (B) MeCP2-GFP lacking the NH2 terminus (MeCP2(aa 163–492)-GFP) is highly concentrated in nucleoli (n) and did not induce chromocenter clustering. (C) Though lacking the MBD, the fusion protein still showed a preference for pericentric regions, although the contrast between nucleoplasmic and chromocenter staining is markedly reduced, compared with A. This preference for pericentric heterochromatin is also evident from the line scan plot. The blue line represents the track of the line scan; “1” and “2” mark chromocenter positions.
Figure 8.
Figure 8.
Clustering of pericentric heterochromatin occurs in muscle tissue of wild-type mice as well as in MeCP2 knock-out mice. Whole mouse myofibers from wild-type mice and MeCP2 null mice were fixed in formaldehyde and stained with DAPI to visualize myotube nuclei and chromocenters. Similar to in vitro–generated myotubes, a high fraction of nuclei showed an increased clustering of pericentric heterochromatin, i.e., chromocenters were large in size and few in number. In the widefield epifluorescent images shown, DAPI staining is in white and phase-contrast in red. Chromocenters are highlighted as intensely stained regions. Muscle fibers showed the characteristic striation by phase-contrast imaging, representing the sarcomeric organization. Bars, 20 μm.
Figure 9.
Figure 9.
MBD2 increases during myogenic differentiation and, in contrast to MBD3, binds to and induces clustering of pericentric heterochromatin in a dose-dependent manner. Mouse myoblasts were transfected with GFP-MBD2 or GFP-MBD3 fusion constructs to test whether high expression levels of the fusion proteins would effect clustering of pericentric regions. In A and D, projection of confocal image stacks are shown. Bars, 20 μm. Note that the cell expressing high levels of GFP-MBD2 shows a remarkable increase in clustering of chromocenters as highlighted by TO-PRO counterstaining, whereas the nucleus with a high concentration of GFP-MBD3 shows an organization of pericentric heterochromatin, comparable to nonexpressing cells. Statistical analysis revealed that the number of chromocenters in cells expressing high levels of GFP-MBD2 is significantly reduced. The corresponding histogram in B illustrates the distinct distribution of chromocenter number of such cells (green) compared with nontransfected controls (blue). (C) Immunoblotting comparing endogenous levels of MBD2 and MBD3 in myoblasts versus myotubes. Histone concentrations were used as loading controls for nuclear proteins. (E) Mid-confocal section of the myoblast nucleus shown in D expressing high levels of GFP-MBD3. Bar, 10 μm. The blue line highlights the path of a line scan crossing four chromocenters (1–4, stained by TO-PRO3). The corresponding fluorescence intensity profile along the path shown in the plot demonstrates a decreased concentration of GFP-MBD3 in pericentric heterochromatin foci (fluorescent peaks at 1–4) and in the nucleolus.

References

    1. Amir, R.E., I.B. Van den Veyver, M. Wan, C.Q. Tran, U. Francke, and H.Y. Zoghbi. 1999. Rett syndrome is caused by mutations in X-linked MECP2, encoding methyl-CpG-binding protein 2. Nat. Genet. 23:185–188. - PubMed
    1. Amor, D.J., P. Kalitsis, H. Sumer, and K.H. Choo. 2004. Building the centromere: from foundation proteins to 3D organization. Trends Cell Biol. 14:359–368. - PubMed
    1. Beil, M., D. Durschmied, S. Paschke, B. Schreiner, U. Nolte, A. Bruel, and T. Irinopoulou. 2002. Spatial distribution patterns of interphase centromeres during retinoic acid-induced differentiation of promyelocytic leukemia cells. Cytometry. 47:217–225. - PubMed
    1. Bird, A.P., and A.P. Wolffe. 1999. Methylation-induced repression—belts, braces, and chromatin. Cell. 99:451–454. - PubMed
    1. Brown, K.E., S.S. Guest, S.T. Smale, K. Hahm, M. Merkenschlager, and A.G. Fisher. 1997. Association of transcriptionally silent genes with Ikaros complexes at centromeric heterochromatin. Cell. 91:845–854. - PubMed

Publication types

MeSH terms