. 2005 Jun 6;169(5):801-11.
doi: 10.1083/jcb.200407123.

A novel acylglycerol kinase that produces lysophosphatidic acid modulates cross talk with EGFR in prostate cancer cells

Affiliations

A novel acylglycerol kinase that produces lysophosphatidic acid modulates cross talk with EGFR in prostate cancer cells

Meryem Bektas et al. J Cell Biol. .

Abstract

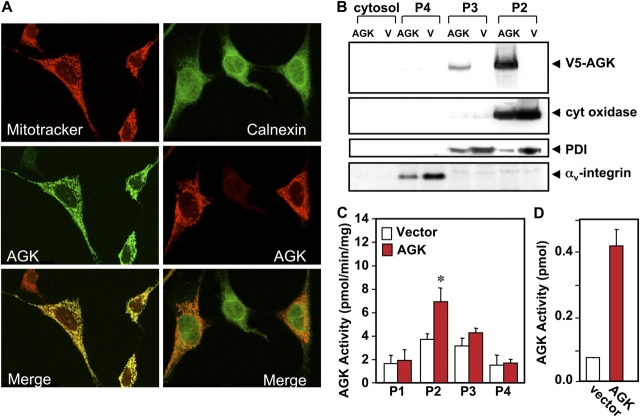
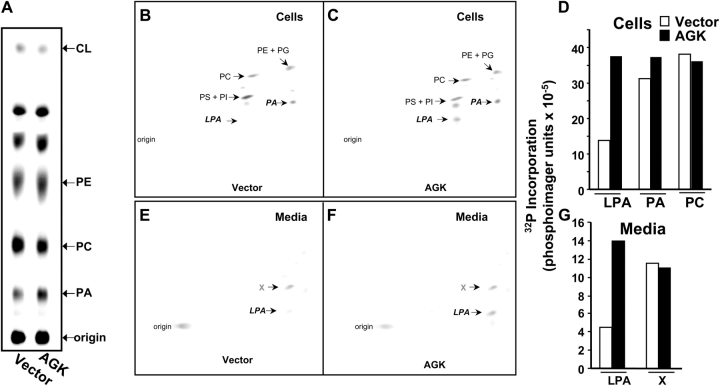
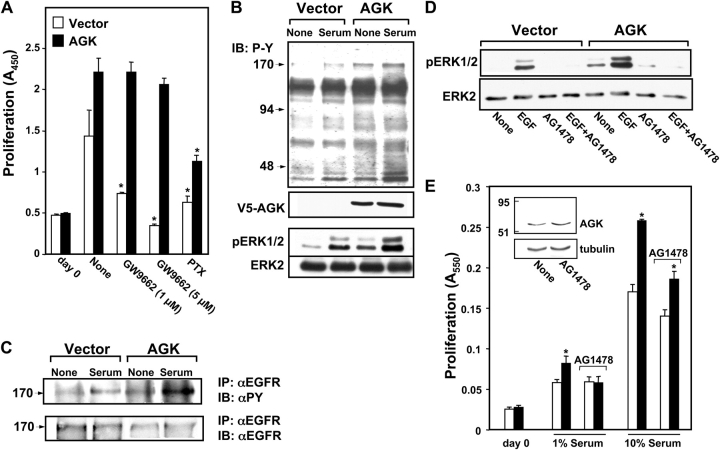
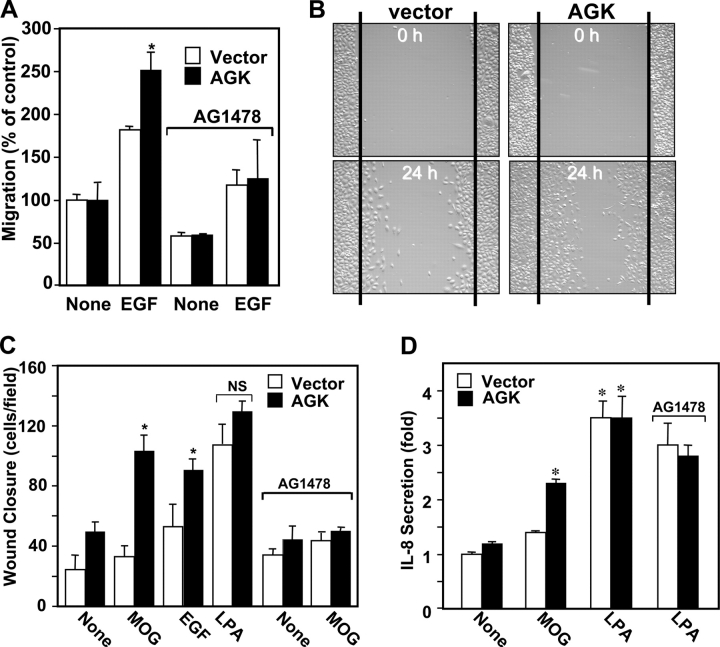
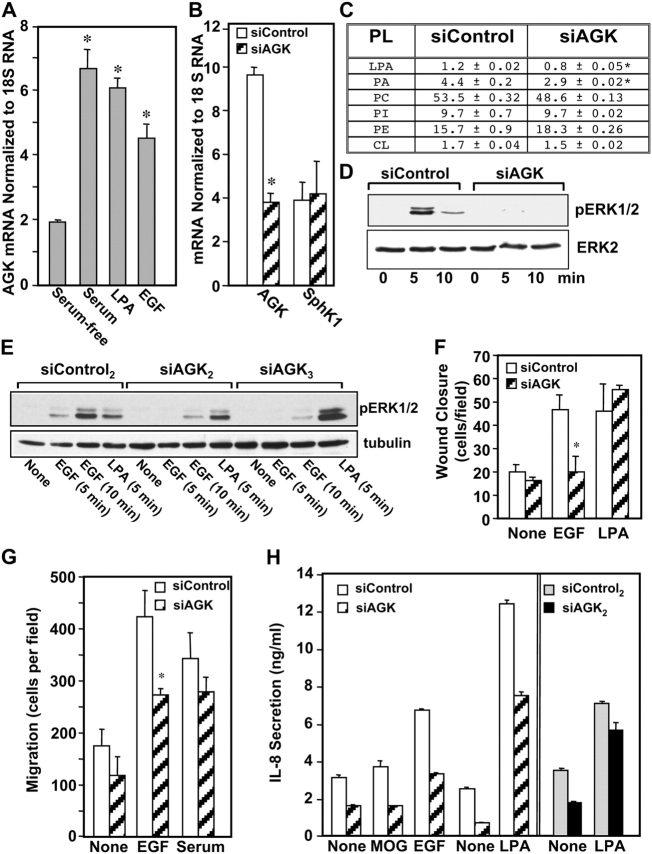
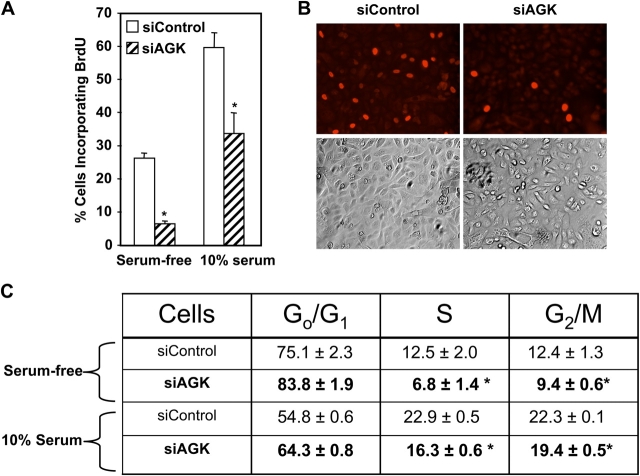
The bioactive phospholipids, lysophosphatidic acid (LPA) and phosphatidic acid (PA), regulate pivotal processes related to the pathogenesis of cancer. Here, we report characterization of a novel lipid kinase, designated acylglycerol kinase (AGK), that phosphorylates monoacylglycerol and diacylglycerol to form LPA and PA, respectively. Confocal microscopy and subcellular fractionation suggest that AGK is localized to the mitochondria. AGK expression was up-regulated in prostate cancers compared with normal prostate tissues from the same patient. Expression of AGK in PC-3 prostate cancer cells markedly increased formation and secretion of LPA. This increase resulted in concomitant transactivation of the EGF receptor and sustained activation of extracellular signal related kinase (ERK) 1/2, culminating in enhanced cell proliferation. AGK expression also increased migratory responses. Conversely, down-regulating expression of endogenous AGK inhibited EGF- but not LPA-induced ERK1/2 activation and progression through the S phase of the cell cycle. Hence, AGK can amplify EGF signaling pathways and may play an important role in the pathophysiology of prostate cancer.


Figures

Figure 1.
Figure 1.
Lipid kinase activity of recombinant AGK. (A) NIH 3T3 cells were transiently transfected with vector, hSphK1, hSphK2, or hAGK. After 24 h, cells were lysed and sphingosine-phosphorylating activity in cell lysates was measured with 50 μM D-erythro-sphingosine (Sph) substrate added as a BSA complex as described previously (Liu et al., 2000). (B) Lipid-phosphorylating activity was determined in cell lysates from NIH 3T3 cells transiently transfected with vector (open bars) or hAGK (closed bars). The following lipids were tested: Sph, C6-cer; 1-oleoyl-2-sn-glycerol (18:1), MOG; 2-arachidonoyl-glycerol (20:4), 2-AG; 1-palmitoyl-2-sn-glycerol (16:0), MPG; 1-stearoyl-2-sn-glycerol (18:0), MSG; or diacylglycerol (1,2-dioleoyl-sn-glycerol), DAG. Where indicated, octyl-β-glucopyranoside detergent was added to a final concentration of 1.5%. The data are expressed as picomoles of phosphorylated product formed per minute per milligram ± SD. Similar results were obtained in four additional experiments. *, P < 0.05 by t test. (C) TLC separation of products formed with MOG as substrate visualized with a phosphoimager.
Figure 2.
Figure 2.
Subcellular localization of AGK. (A) NIH 3T3 fibroblasts were transiently transfected with V5-tagged AGK and mitochondria stained with MitoTracker red. The ER was visualized with anti-calnexin antibody followed by FITC-conjugated anti-rabbit as the secondary antibody. AGK was stained with monoclonal anti-V5 antibody followed by secondary FITC-conjugated or Texas red–conjugated anti–mouse antibody. Cells were visualized by dual wavelength confocal microscopy. Superimposed merged pictures are shown in the bottom panels, with yellow indicating colocalization. (B and C) Activity and expression of AGK in subcellular fractions. Lysates from HEK 293 cells transfected with vector or V5-AGK and P2 (mitochondria), P3 (ER and Golgi), P4 (plasma membrane), and cytosol fractions isolated. The P1 fraction containing nuclei and unbroken cells was not examined. 25 μg of proteins were resolved by SDS-PAGE and immunoblotted with anti-V5 antibody or with antibodies to the specific organelle markers anti–cytochrome c oxidase, anti-phosphodisulfide isomerase (PDI), and anti–αv-integrin. AGK activity was also determined in each subcellular fraction with MOG as substrate. Results are means ± SD of triplicate determinations. Similar results were obtained in two additional experiments. *, P < 0.05 by t test. (D) 400-μg aliquots of lysates from HEK 293 cells transiently transfected with vector (open bars) or V5-AGK (closed bars) were immunoprecipitated with anti-V5 antibody as described in Materials and methods, and AGK activity was determined in the immunoprecipitates. Data are expressed as picomoles of LPA formed in 30 min and are means ± SD of duplicate determinations.
Figure 3.
Figure 3.
Effect of AGK on phospholipids. (A) PC-3 cells stably transfected with vector or AGK were labeled with 32P-orthophosphate for 2 h. Phospholipids were then extracted from mitochondria isolated by differential centrifugation. After separation of equal amounts of 32P-labeled phospholipids by one-dimensional TLC, radioactive spots were visualized with a phosphoimager and the indicated lipids were identified based on comigration with authentic standards. The ratio of 32P-PA to 32P-PC in vector and AGK transfectants was 0.38 ± 0.02 and 0.68 ± 0.03, respectively. (B–G). LPA production and secretion induced by expression of AGK. PC-3 cells stably transfected with vector or AGK were prelabeled with 32P-orthophosphate for 2 h, washed, and incubated for 2 h in chemically defined medium. Lipids were extracted from cells (B–D) and media (E–G). Equal amounts of 32P-phospholipids were separated by two-dimensional HPTLC, first in chloroform/methanol/formic acid/water (60:30:7:3, vol/vol), followed by chloroform/methanol/ammonium hydroxide/water (50:40:8:2, vol/vol). Radioactive spots were visualized with a phosphoimager, and the indicated lipids were identified based on comigration with authentic standards. (D and G) 32P incorporation into the indicated phospholipids (LPA, PA, PC, and unidentified phospholipid [X]) was quantified by phosphoimager. Similar results were obtained in two additional experiments.
Figure 4.
Figure 4.
Expression of hAGK. (A) Northern blot analysis of hAGK expression in human tissues. Random labeled probe was hybridized to poly(A)+ RNA blots from the indicated human tissues. β-Actin expression was used to confirm equal loading. (B) Matched tumor/normal array analysis of hAGK expression. An array containing cDNA samples from multiple tissues and tumor types as well as nine cancer cell lines was probed with 32P-labeled AGK probe. Each pair of tumor and normal samples came from the same patient. Human cancer cell lines: (1) HeLa; (2) Burkitt's lymphoma, Daudi; (3) chronic myelogenous leukemia; (4) promyelocytic leukemia HL-60; (5) melanoma; (6) lung carcinoma; (7) lymphoblastic leukemia, MOLT-4; (8) colorectal adenocarcinoma, SW480; (9) Burkitt's lymphoma, Raji. There was no specific hybridization to the control nucleic acids, which included ubiquitin cDNA, yeast total RNA, yeast tRNA, Escherichia coli DNA, poly(A), human Cot-1 DNA, and human genomic DNA. (C–E) AGK stimulates proliferation. PC-3 cells stably transfected with vector (open symbols) or AGK (closed symbols) were cultured in serum-free medium supplemented with 0.5% serum (C), 10 μM LPA (D), or 10 μM MOG (E), and cell numbers determined at the indicated days. Data are expressed as fold increase relative to day 0 and are means ± SD. Similar results were obtained in two additional experiments. Asterisks denote significant differences (P < 0.05, t test). (F) AGK does not enhance proliferation of RH7777 cells. RH7777 cells were cotransfected with vector (open bars) or AGK (closed bars) together with GFP at a ratio of 4:1. After 24 h, cells were cultured in serum-free medium or in the presence of 0.5% serum. BrdU was added 16 h later for an additional 3 h. Double immunofluorescence was used to visualize transfected cells and BrdU incorporation into nascent DNA. The proportion of cells incorporating BrdU among total GFP transfected cells was determined. Data are means ± SD of triplicate cultures from a representative experiment. At least three different fields with a minimum of 100 cells/field were scored.
Figure 5.
Figure 5.
Regulation of cell growth and EGFR signaling by AGK. (A) Effect of PTX and the PPARγ antagonist GW9662 on AGK-induced proliferation. PC-3 cells stably transfected with vector (open bars) or AGK (closed bars) were cultured in medium supplemented with 1% serum without or with GW9662 (1 μM or 5 μM) or with PTX (100 ng/ml), and cell proliferation was determined after 6 d with WST-1. Asterisks denote significant differences compared with untreated controls (P < 0.05, t test). (B) Enforced expression of AGK enhances EGFR tyrosine phosphorylation and stimulates ERK1/2. Serum-starved PC-3 cells stably transfected with vector or AGK were stimulated without or with 10% serum for 10 min, lysed and immunoblotted with anti-phosphotyrosine, anti-V5 antibody, or phospho-specific anti-ERK1/2 antibodies. Blots were stripped and reprobed with ERK2 antibody to demonstrate equal loading. (C) AGK expression induces EGFR transactivation. Lysates from cells treated as in B were immunoprecipitated with anti-EGFR antibody and the immunoprecipitates were analyzed by Western blotting using anti-phosphotyrosine or anti-EGFR antibody. (D and E) Blockage of EGFR signaling suppresses ERK activation and cell growth advantage mediated by AGK. (D) Serum-starved PC-3 cells stably transfected with vector or AGK were preincubated for 60 min in the absence or presence of 200 nM AG1478, and then treated with EGF for 10 min. Cell lysate proteins were analyzed by immunoblotting with phospho-specific ERK1/2 antibody. Blots were stripped and reprobed with ERK2 antibody to demonstrate equal loading. (E) PC-3 cells stably transfected with vector or AGK were cultured in medium supplemented with 1 or 10% serum with or without 200 nM AG1478, and cell proliferation was determined after 6 d with crystal violet. Similar results were obtained in two additional experiments. Asterisks denote significant differences (P < 0.05, t test). (inset) PC-3 cells stably transfected with V5-AGK were incubated for 6 d without (None) or with AG1478, and AGK expression was determined by immunoblotting with anti-V5 antibody. The blot was stripped and reprobed with anti-tubulin as a loading control.
Figure 6.
Figure 6.
EGFR is required for AGK-stimulated cell migration toward EGF and wound closure. (A) PC-3 cells transfected with vector (open bars) or AGK (closed bars) were pretreated without or with 200 nM AG1478 for 20 min and allowed to migrate for 3 h toward EGF (10 ng/ml). The data are means ± SD of two determinations. Similar results were obtained in two independent experiments. (B and C) Monolayers of vector (open bars) or AGK (closed bars) PC-3 transfectants were wounded and treated with vehicle, MOG (10 μM), LPA (10 μM), or EGF (10 ng/ml). Where indicated, cells were also treated with 200 nM AG1478. (B) Representative images of a wound healing assay with vector and AGK-transfected PC-3 cells before and 24 h after treatment with MOG. (C) Migration of cells into the wound was determined after 24 h by processing digital photographs with ImagePro Plus. (D) AGK induces IL-8 secretion. PC-3 cells transfected with vector (open bars) or AGK (closed bars) were serum starved for 24 h and treated in serum-free DME with or without MOG (10 μM) or LPA (1 μM) for 16 h, and IL-8 secretion was measured by ELISA. Where indicated, cells were also treated with 200 nM AG1478. *, P < 0.05 by t test.
Figure 7.
Figure 7.
Effectiveness and specificity of siAGK. (A) Expression of endogenous AGK. Naïve PC-3 cells were serum starved for 24 h and treated in DME with or without 10% serum, LPA (10 μM), or EGF (100 ng/ml) for 16 h, and AGK mRNA was determined by quantitative real-time PCR. Data were normalized to expression of 18S RNA and are means ± SD of triplicate determinations. *, P < 0.05 by t test. (B) PC-3 cells were transfected with control siRNA (open bars) or siRNA specific for AGK (hatched bars) and mRNA levels of AGK and SphK1, and 18S RNA was determined by QPCR. (C) Duplicate cultures were labeled with 32Pi for 12 h. Phospholipids were extracted from mitochondria isolated by differential centrifugation. Equal amounts of 32P-phospholipids were separated by TLC, and the indicated phospholipids were quantified with a phosphoimager. The data are expressed as a percentage of total 32P-labeled phospholipids and are means ± SD of duplicate determinations. *, P < 0.05 by t test. (D) Down-regulation of AGK with siRNA blocks EGF-induced ERK1/2. PC-3 cells were transfected with control siRNA or siRNA specific for AGK and treated without (None) or with 10 ng/ml EGF for the indicated times. Equal amounts of lysate proteins were separated by SDS-PAGE, and ERK1/2 activation was determined by immunoblotting with anti-pERK1/2. Blots were stripped and reprobed with anti-ERK2 as a loading control. (E) PC-3 cells were transfected with siControl2, siAGK2, or siAGK3 (Dharmacon), as described in Materials and methods, and treated with EGF (10 ng/ml) or LPA (10 μM) for the indicated times. Equal amounts of lysate proteins were separated by SDS-PAGE and ERK1/2 activation determined by immunoblotting with anti-pERK1/2. Blots were stripped and reprobed with anti-tubulin as a loading control. Down-regulation of AGK decreases EGF-induced wound closure and migration. (F) Monolayers of PC-3 cells transfected with control siRNA (open bars) or siRNA specific for AGK (hatched bars) were wounded and treated with vehicle (None), EGF (10 ng/ml), or LPA (10 μM), and migration of cells into the wound was determined after 24 h. (G) Cells from duplicate cultures were allowed to migrate for 3 h in Boyden chambers toward vehicle (None), EGF (10 ng/ml), or serum (10%). The data are means ± SD of two determinations. (H) Down-regulation of AGK with siRNA decreases IL-8 secretion. PC-3 cells were transfected with the indicated control siRNAs (open bars and gray bars) or siRNAs specific for AGK (hatched bars and black bars), incubated in serum-free DME without (None) or with MOG (10 μM), LPA (1 μM), or EGF (10 ng/ml) for 16 h, and IL-8 secretion was measured. *, P < 0.05 by t test.
Figure 8.
Figure 8.
Involvement of endogenous AGK in cell proliferation. (A) PC-3 cells were transfected with control siRNA (open bars) or siAGK (hatched bars) and serum starved for 8 h. After culturing for an additional 16 h in serum-free medium or in medium supplemented with 10% serum, BrdU was added for 3 h and the fraction of cells incorporating BrdU was determined. Data are means ± SD of duplicate cultures from a representative experiment. At least three different fields were scored with a minimum of 100 cells per field. Similar results were obtained in two independent experiments. (B) Representative fluorescent and phase images of siControl and siAGK-transfected cells. (C) Cell cycle analysis. PC-3 cells transfected with control siRNA or siAGK were cultured in serum-free medium or in medium supplemented with 10% serum. After 24 h, cellular DNA was stained with propidium iodide and cell cycle analysis was performed with an Epics XL-MCL flow cytofluorometer (Beckman Coulter). Asterisks indicate significant differences from vector-transfected values as determined by t test (P ≤ 0.05).

References

    1. Baker, D.L., D.M. Desiderio, D.D. Miller, B. Tolley, and G.J. Tigyi. 2001. Direct quantitative analysis of lysophosphatidic acid molecular species by stable isotope dilution electrospray ionization liquid chromatography-mass spectrometry. Anal. Biochem. 292:287–295. - PubMed
    1. Bookout, A.L., A.E. Finney, R. Guo, K. Peppel, W.J. Koch, and Y. Daaka. 2003. Targeting Gbetagamma signaling to inhibit prostate tumor formation and growth. J. Biol. Chem. 278:37569–37573. - PubMed
    1. Bunting, M., W. Tang, G.A. Zimmerman, T.M. McIntyre, and S.M. Prescott. 1996. Molecular cloning and characterization of a novel human diacylglycerol kinase ζ. J. Biol. Chem. 271:10230–10236. - PubMed
    1. Chakraborty, T.R., A. Vancura, V.S. Balija, and D. Haldar. 1999. Phosphatidic acid synthesis in mitochondria. Topography of formation and transmembrane migration. J. Biol. Chem. 274:29786–29790. - PubMed
    1. Fang, Y., M. Vilella-Bach, R. Bachmann, A. Flanigan, and J. Chen. 2001. Phosphatidic acid-mediated mitogenic activation of mTOR signaling. Science. 294:1942–1945. - PubMed

Publication types

MeSH terms