. 2005 Jun 6;201(11):1805-14.
doi: 10.1084/jem.20050011.

Live imaging of effector cell trafficking and autoantigen recognition within the unfolding autoimmune encephalomyelitis lesion

Affiliations

Live imaging of effector cell trafficking and autoantigen recognition within the unfolding autoimmune encephalomyelitis lesion

Naoto Kawakami et al. J Exp Med. .

Abstract

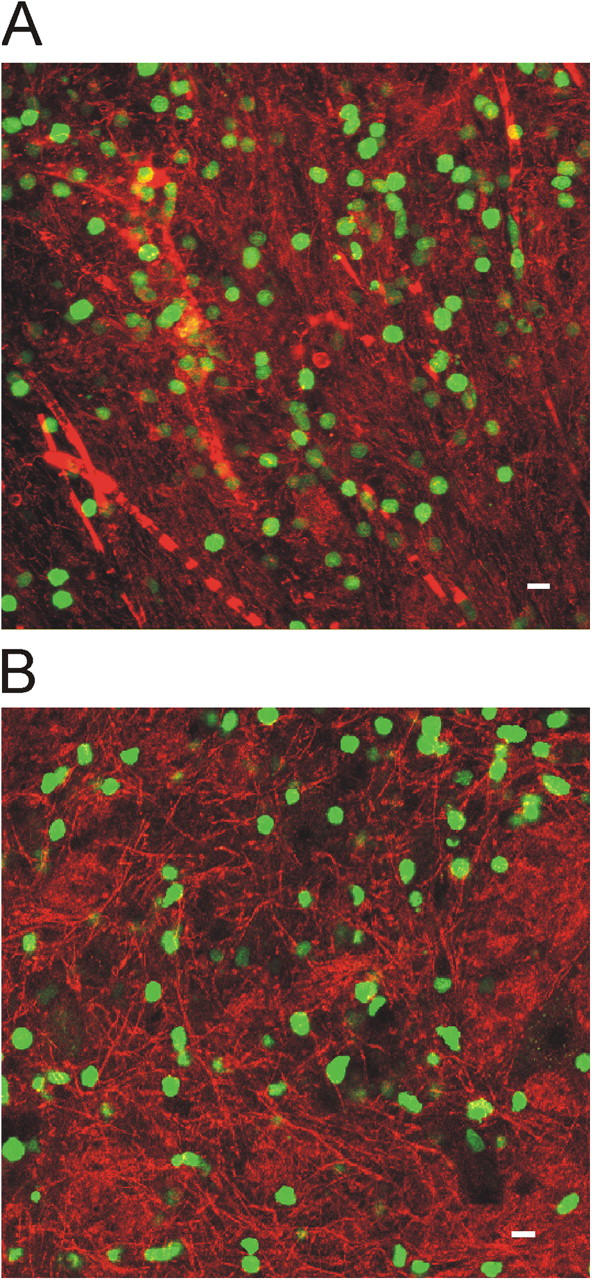
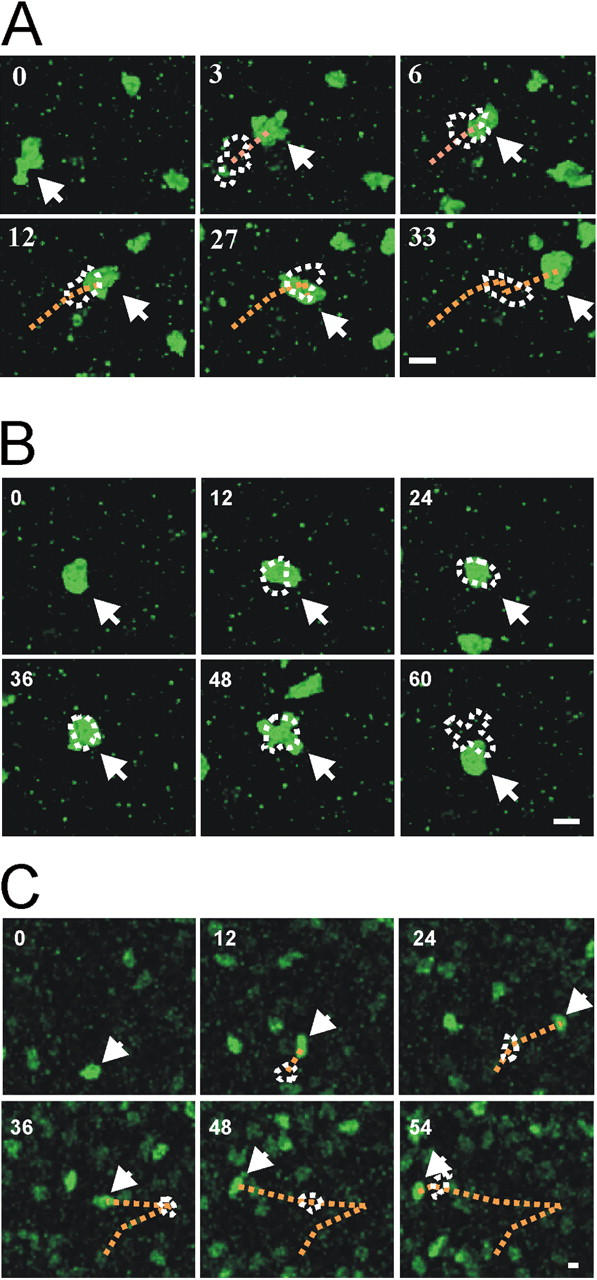
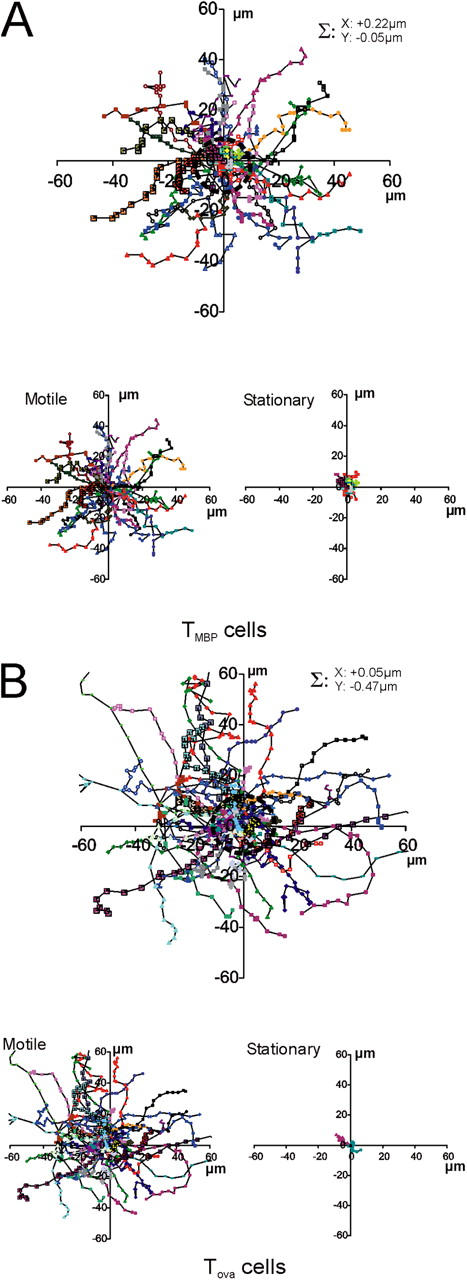
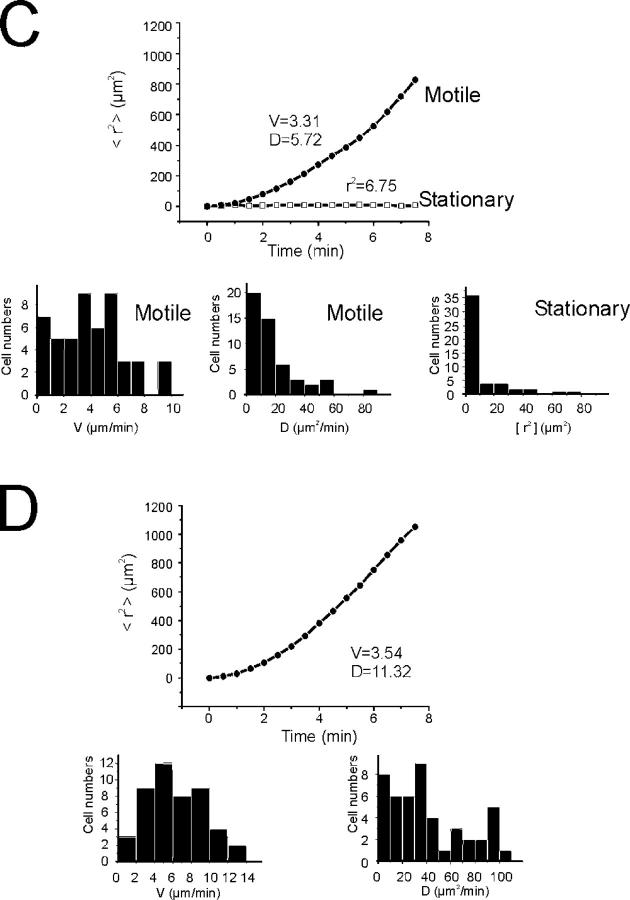
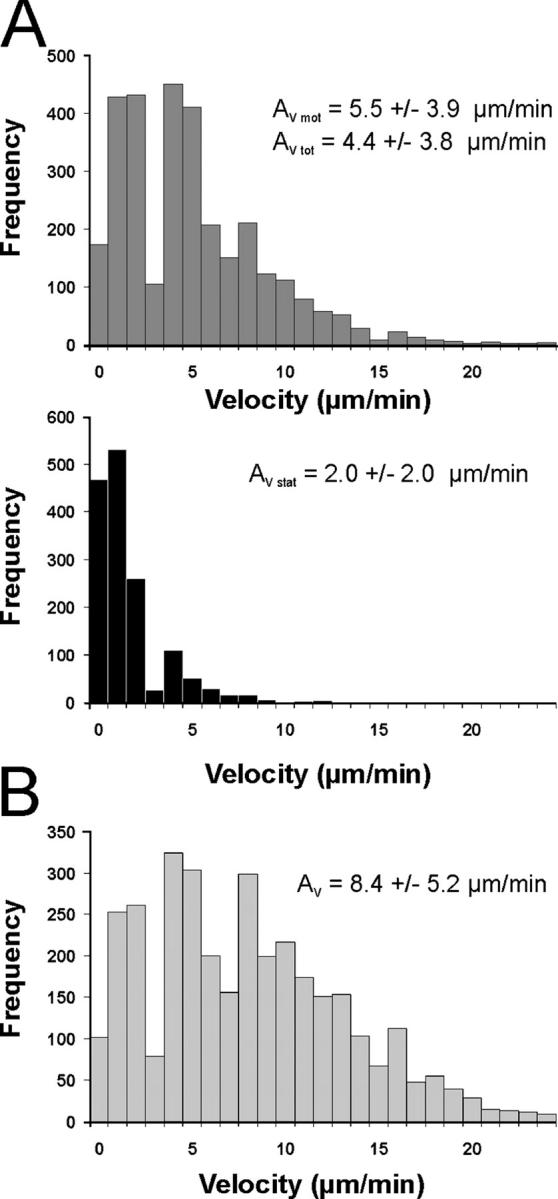
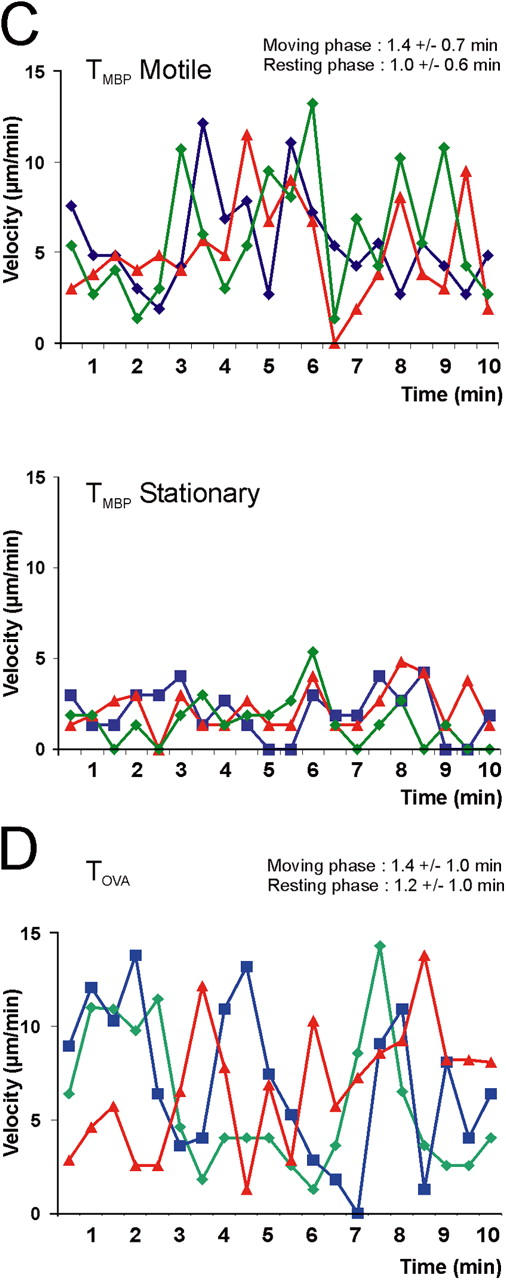
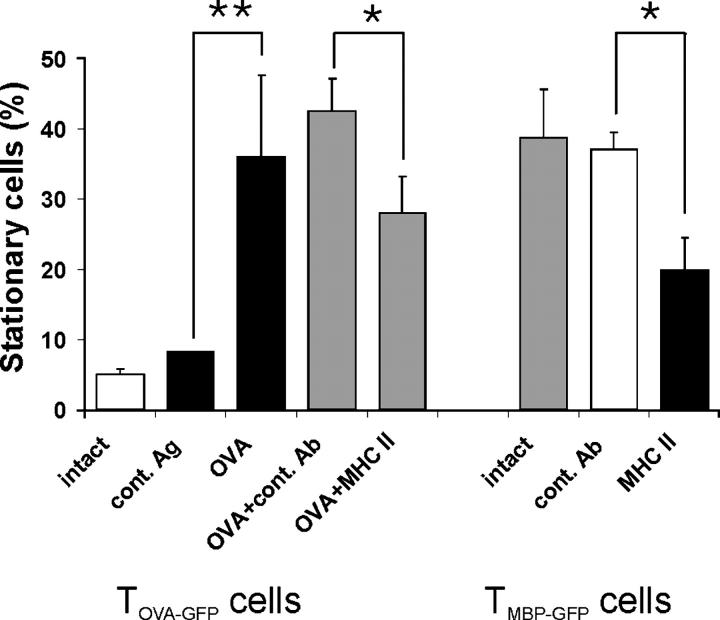
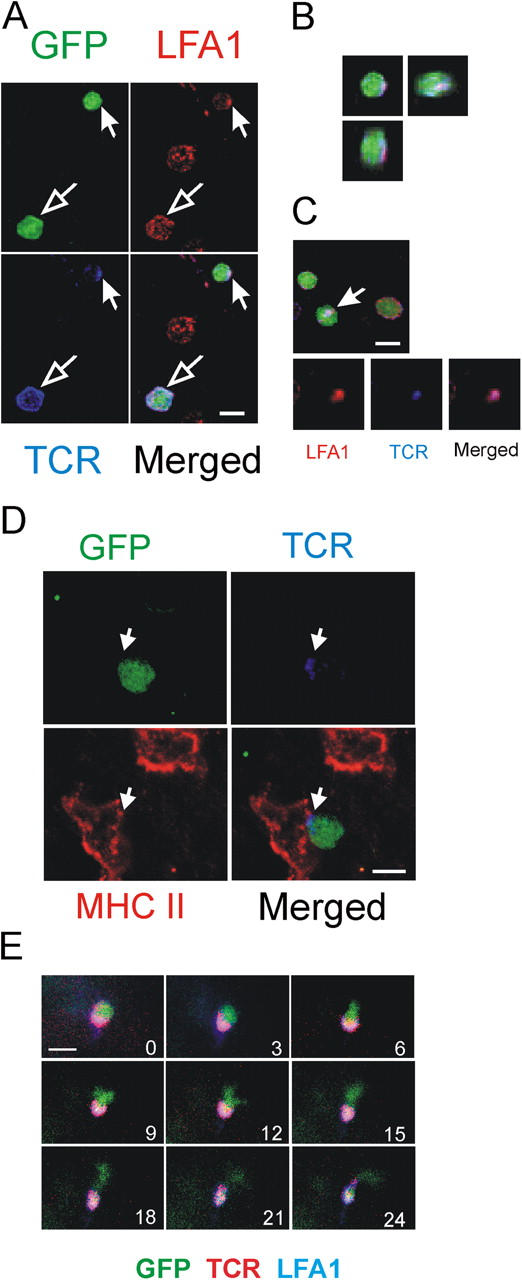
We tracked pathogenic myelin basic protein-specific CD4+ effector T cells in early central nervous system (CNS) lesions of experimental autoimmune encephalomyelitis (EAE) by combining two-photon imaging and fluorescence video microscopy. We made two key observations: (a) the majority of the cells (65%) moved fast (maximal speed 25 microm/min) and apparently nondirected through the compact tissue; and (b) a second group of effector T cells (35%) appeared tethered to a fixed point. Polarization of T cell receptor and adhesion molecules (lymphocyte function-associated antigen 1) towards this fixed point suggests the formation of immune synapses. Nonpathogenic, ovalbumin-specific T cells were not tethered in the CNS and did not form synapse-like contacts, but moved through the tissue. After intrathecal injection of antigen, 40% of ovalbumin-specific T cells became tethered. Conversely, injection of anti-major histocompatibility complex class II antibodies profoundly reduced the number of stationary pathogenic T cells within the CNS (to 15%). We propose that rapid penetration of the CNS parenchyma by numerous autoimmune effector T cells along with multiple autoantigen-presentation events are responsible for the fulminate development of clinical EAE.


Figures

Figure 1.
Figure 1.
Distribution of TMBP-GFP and TOVA-GFP cells in early EAE lesions. (A) Confocal microscopy showing TMBP-GFP cells (green) in spinal cord lesions 4 days after transfer. Vessels are visualized by dextran–Texas red injection. (B) Distribution of TOVA-GFP cells in EAE lesions 4 d after cotransfer with nonlabeled TMBP cells. CNS parenchyma is labeled by Topro. Bars, 10 μm.
Figure 2.
Figure 2.
Motility of auto and control antigen-specific T cells in EAE lesions. (A, B) Two-photon live microscopy of TMBP-GFP cells in acute spinal cord slices. Two types of T cell movements are observed within CNS lesions: “motile” (A) and “stationary” (B) TMBP-GFP cells. Numbers indicate time after start of the analysis (minutes). Dotted lines indicate the trajectories and the cell shape of the preceding pictures. Arrows point to the tracked cells. Representative cells of 10 videos from four independent experiments. Bars, 10 μm. (C) Locomotion of TOVA-GFP cells in living spinal cord slices analyzed by two-photon analysis (4 d after cotransfer of TMBP cells and TOVA-GFP cells). A representative cell of 6 videos from three independent experiments is shown. Bar, 10 μm. (D) Proportion of motile versus stationary MBP- (TMBP cells) and OVA- (TOVA cells) specific T cells in living CNS slices (video microscopy). Motile T cells were defined as cells which migrated >10 μm in 10 min. Cells were grouped as stationary if they moved <10 μm in 10 min. TMBP cells: means ± SD from 6 independent experiments including >700 cells from 11 videos. TOVA cells: means ± SD of 187 cells from 4 videos and three independent experiments. Student's t test, *P < 0.001.
Figure 2.
Figure 2.
Motility of auto and control antigen-specific T cells in EAE lesions. (A, B) Two-photon live microscopy of TMBP-GFP cells in acute spinal cord slices. Two types of T cell movements are observed within CNS lesions: “motile” (A) and “stationary” (B) TMBP-GFP cells. Numbers indicate time after start of the analysis (minutes). Dotted lines indicate the trajectories and the cell shape of the preceding pictures. Arrows point to the tracked cells. Representative cells of 10 videos from four independent experiments. Bars, 10 μm. (C) Locomotion of TOVA-GFP cells in living spinal cord slices analyzed by two-photon analysis (4 d after cotransfer of TMBP cells and TOVA-GFP cells). A representative cell of 6 videos from three independent experiments is shown. Bar, 10 μm. (D) Proportion of motile versus stationary MBP- (TMBP cells) and OVA- (TOVA cells) specific T cells in living CNS slices (video microscopy). Motile T cells were defined as cells which migrated >10 μm in 10 min. Cells were grouped as stationary if they moved <10 μm in 10 min. TMBP cells: means ± SD from 6 independent experiments including >700 cells from 11 videos. TOVA cells: means ± SD of 187 cells from 4 videos and three independent experiments. Student's t test, *P < 0.001.
Figure 3.
Figure 3.
Encephalitogenic, but not control-antigen specific, TGFP cells show confined motility within the CNS. (A, B) Random walk of TGFP cells within the CNS. (A) Superimposed trajectories of TMBP-GFP cells (each line represents one cell) over a 10-min time span analyzed by video microscopy. Σ: trajectory vector calculated from the sum of all cell trajectory vectors divided by the number of cells (n = 200 cells). Top plot: trajectories of stationary and motile TMBP-GFP cells. Bottom left plot: motile T cells; bottom right plot: stationary T cells. 50 trajectories from 4 independent experiments. (B) Trajectories of TOVA GFP cells in the CNS. 50 trajectories from 3 independent experiments. (C, D) Mean square displacements of TGFP cells plotted against time. (C) Representative plots for a motile (circles) and a stationary (squares) TMBP-GFP cell are shown. The diffusion coefficient of D = 5.72 μm/min of the curve and the cell velocity of V = 3.31 μm/min indicate free movement of the motile cell. The motility of the stationary cell is strongly confined, as reflected by the plateau at r2 = 6.75. Bar diagrams: velocities and diffusion coefficients of 50 motile T cells, and r2 values of 50 stationary cells. Mean square displacements were calculated from 21,198 displacement steps. (D) Mean square displacements of TOVA-GFP cells within the CNS. A representative plot for a TOVA-GFP cell shows nonrestrained motility, indicated by a diffusion coefficient of D = 11.32 μm/min and a cell velocity of V = 3.54 μm/min. Bar diagrams: velocities and diffusion coefficients of 50 TOVA-GFP cells. 9,347 time points were analyzed for evaluation of mean square displacements.
Figure 3.
Figure 3.
Encephalitogenic, but not control-antigen specific, TGFP cells show confined motility within the CNS. (A, B) Random walk of TGFP cells within the CNS. (A) Superimposed trajectories of TMBP-GFP cells (each line represents one cell) over a 10-min time span analyzed by video microscopy. Σ: trajectory vector calculated from the sum of all cell trajectory vectors divided by the number of cells (n = 200 cells). Top plot: trajectories of stationary and motile TMBP-GFP cells. Bottom left plot: motile T cells; bottom right plot: stationary T cells. 50 trajectories from 4 independent experiments. (B) Trajectories of TOVA GFP cells in the CNS. 50 trajectories from 3 independent experiments. (C, D) Mean square displacements of TGFP cells plotted against time. (C) Representative plots for a motile (circles) and a stationary (squares) TMBP-GFP cell are shown. The diffusion coefficient of D = 5.72 μm/min of the curve and the cell velocity of V = 3.31 μm/min indicate free movement of the motile cell. The motility of the stationary cell is strongly confined, as reflected by the plateau at r2 = 6.75. Bar diagrams: velocities and diffusion coefficients of 50 motile T cells, and r2 values of 50 stationary cells. Mean square displacements were calculated from 21,198 displacement steps. (D) Mean square displacements of TOVA-GFP cells within the CNS. A representative plot for a TOVA-GFP cell shows nonrestrained motility, indicated by a diffusion coefficient of D = 11.32 μm/min and a cell velocity of V = 3.54 μm/min. Bar diagrams: velocities and diffusion coefficients of 50 TOVA-GFP cells. 9,347 time points were analyzed for evaluation of mean square displacements.
Figure 4.
Figure 4.
Movement pattern of TGFP cells within the CNS. (A, B) Velocity of TGFP cells in EAE lesions analyzed by fluorescence video microscopy. (A) TMBP-GFP cells were tracked in acute spinal cord slices 4 d after transfer, and the locomotion speed of motile (top histogram) and stationary (bottom histogram) cells was calculated. Instantaneous T cell velocities of 236 cells (160 motile and 76 stationary cells) determined at 10-s intervals up to 10 min (4,616 time points) are shown. Average velocity (Av) is indicated. AV mot: AV of motile TMBP-GFP cells, AV stat: AV of stationary TMBP-GFP cells, AV tot: AV of all analyzed TMBP-GFP cells. (B) Instantaneous velocities of TOVA-GFP cells in the CNS. 188 cells were analyzed every 30 sec up to 10 min (3,375 time points). (C, D) “Stop and go” motility mode of TGFP cells. (C) TMBP-GFP cells displayed characteristic transitions from moving to resting phases and vice versa on their way through the CNS tissue (determined by the velocity of the cells over time). Resting phases were defined as <5 μm/min, and moving phases were defined as >5 μm/min. The duration of these phases is indicated within the graph. Top graph: motile TMBP-GFP cells; bottom graph: stationary TMBP-GFP cells. Six representative cells out of 236 cells are shown. (D) Moving pattern of TOVA-GFP cells within the CNS. Three representative cells out of 188 cells are shown. Analysis by fluorescence video microscopy.
Figure 4.
Figure 4.
Movement pattern of TGFP cells within the CNS. (A, B) Velocity of TGFP cells in EAE lesions analyzed by fluorescence video microscopy. (A) TMBP-GFP cells were tracked in acute spinal cord slices 4 d after transfer, and the locomotion speed of motile (top histogram) and stationary (bottom histogram) cells was calculated. Instantaneous T cell velocities of 236 cells (160 motile and 76 stationary cells) determined at 10-s intervals up to 10 min (4,616 time points) are shown. Average velocity (Av) is indicated. AV mot: AV of motile TMBP-GFP cells, AV stat: AV of stationary TMBP-GFP cells, AV tot: AV of all analyzed TMBP-GFP cells. (B) Instantaneous velocities of TOVA-GFP cells in the CNS. 188 cells were analyzed every 30 sec up to 10 min (3,375 time points). (C, D) “Stop and go” motility mode of TGFP cells. (C) TMBP-GFP cells displayed characteristic transitions from moving to resting phases and vice versa on their way through the CNS tissue (determined by the velocity of the cells over time). Resting phases were defined as <5 μm/min, and moving phases were defined as >5 μm/min. The duration of these phases is indicated within the graph. Top graph: motile TMBP-GFP cells; bottom graph: stationary TMBP-GFP cells. Six representative cells out of 236 cells are shown. (D) Moving pattern of TOVA-GFP cells within the CNS. Three representative cells out of 188 cells are shown. Analysis by fluorescence video microscopy.
Figure 5.
Figure 5.
T cell motility depends on the presence of antigen and MHC class II. TOVA-GFP cells become stationary after intrathecal OVA injection. Live imaging of acute spinal cord slices 4 d after cotransfer of TMBP and TOVA-GFP cells. Left five bars: proportion of stationary TOVA-GFP cells without manipulation (white bar) or 3 h after intrathecal injection of the control antigen BSA (cont. Ag), OVA, OVA plus isotype Ig control (OVA + cont. Ab), or OVA plus anti-MHC class II antibody (OVA + MHC II). Means ± SD of 412 cells from eight videos and five independent experiments. *P < 0.02; **P < 0.002. Right three bars: blocking anti-MHC class II antibody reduces the number of stationary TMBP-GFP cells in the CNS. Proportion of stationary TMBP-GFP cells in spinal cord slices 3 h after intrathecal injection of anti-MHC class II antibodies (MHC II, black bar). No manipulation (intact) or injection of isotype control antibody (cont. Ab) served as controls. Means ± SD of 320 analyzed cells. Video recording of six videos of three independent experiments (P < 0.001). Statistical significances were evaluated using Student's t test.
Figure 6.
Figure 6.
Immune synapses-like membrane structures in the CNS. (A) Polarization of TCR/LFA-1 in TMBP-GFP cells 4 d after transfer in spinal cord slices. Confocal imaging, immunostaining with TCR/LFA-1. GFP (green), LFA-1 (red), TCR (blue). TMBP-GFP cells with polarized (closed arrow) and evenly distributed (open arrow) TCR/LFA-1 pattern. (B) Three-dimensional reconstruction of the synapse-like–forming TMBP-GFP cell (indicated cell from Fig. 6 A). (C) Contact plane of a TMBP-GFP cell with synapse-like TCR/LFA-1 polarization (arrow). (D) TMBP-GFP cell (green) contacting a MHC class II+ cell (red). Note the polarization of TCR (blue) at the contact point of the cells. (E) TMBP-GFP cells that form synapse-like TCR/LFA-1 polarizations are “stationary.” Fluorescence video microscopy of living spinal cord tissue 4 d after transfer stained with anti-TCR/LFA-1 antibodies. Numbers indicate the time points of image acquisition. Overlay of GFP (green), TCR (red), and LFA1 (blue) is shown. Bars, 10 μm.

Similar articles

Cited by

References

    1. Steinman, L. 1996. A few autoreactive cells in an autoimmune infiltrate control a vast population of nonspecific cells: A tale of smart bombs and the infantry. Proc. Natl. Acad. Sci. USA. 93:2253–2256. - PMC - PubMed
    1. Ben-Nun, A., H. Wekerle, and I.R. Cohen. 1981. The rapid isolation of clonable antigen-specific T lymphocyte lines capable of mediating autoimmune encephalomyelitis. Eur. J. Immunol. 11:195–199. - PubMed
    1. Wekerle, H., K. Kojima, J. Lannes-Vieira, H. Lassmann, and C. Linington. 1994. Animal models. Ann. Neurol. 36:S47–S53. - PubMed
    1. Delovitch, T.L. and B. Singh. 1997. The nonobese diabetic mouse as a model of autoimmune diabetes: Immune dysregulation gets the NOD. Immunity. 7:727–738. - PubMed
    1. Wekerle, H., C. Linington, H. Lassmann, and R. Meyermann. 1986. Cellular immune reactivity within the CNS. Trends Neurosci. 9:271–277.

Publication types

MeSH terms

Substances