Comparative Study
. 2005 Jun 14;102(24):8674-9.
doi: 10.1073/pnas.0500105102. Epub 2005 Jun 6.

Characterization of two avian MHC-like genes reveals an ancient origin of the CD1 family

Affiliations
Comparative Study

Characterization of two avian MHC-like genes reveals an ancient origin of the CD1 family

Marcia M Miller et al. Proc Natl Acad Sci U S A. .

Abstract

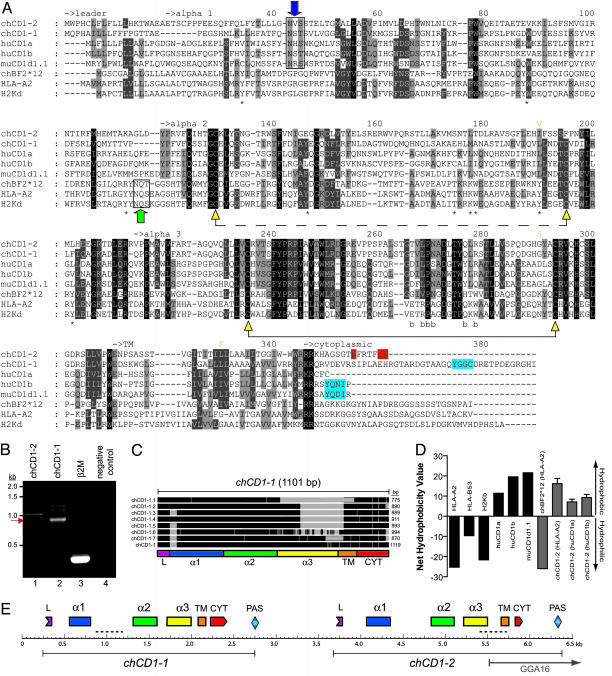
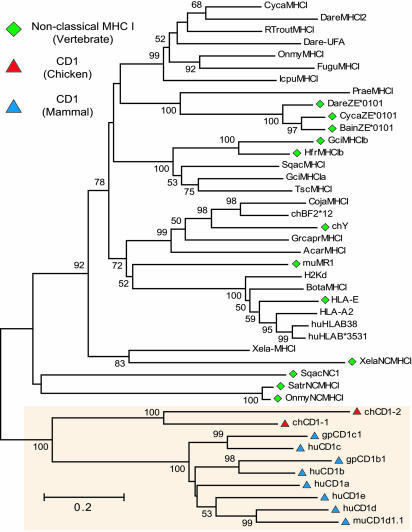
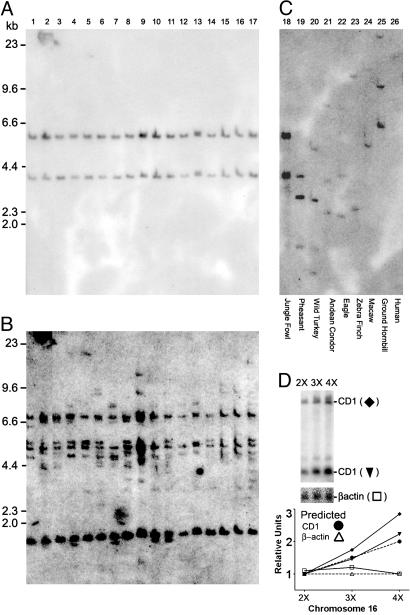
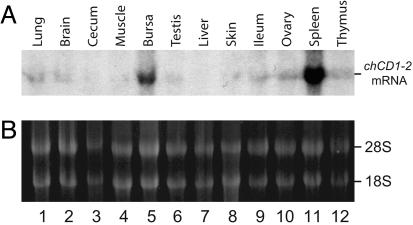
Many of the genes that comprise the vertebrate adaptive immune system are conserved across wide evolutionary time scales. Most notably, homologs of the mammalian MHC gene family have been found in virtually all jawed vertebrates, including sharks, bony fishes, reptiles, and birds. The CD1 family of antigen-presenting molecules are related to the MHC class I family but have evolved to bind and present lipid antigens to T cells. Here, we describe two highly divergent nonclassical MHC class I genes found in the chicken (Gallus gallus) that have sequence homology to the mammalian CD1 family of proteins. One of the chicken CD1 genes expresses a full-length transcript, whereas the other has multiple splice variants. Both Southern blot and single nucleotide polymorphism analysis indicates that chicken CD1 is relatively nonpolymorphic. Moreover, cross-hybridizing bands are present in other bird species, suggesting broad conservation in the avian class. Northern analysis of chicken tissue shows a high level of CD1 expression in the bursa and spleen. In addition, molecular modeling predicts that the potential antigen-binding pocket is probably hydrophobic, a universal characteristic of CD1 molecules. Genomic analysis indicates that the CD1 genes are located on chicken chromosome 16 and maps to within 200 kb of the chicken MHC B locus, suggesting that CD1 genes diverged from classical MHC genes while still linked to the major histocompatibility complex locus. The existence of CD1 genes in an avian species suggests that the origin of CD1 extends deep into the evolutionary history of terrestrial vertebrates.


Figures

Fig. 1.
Fig. 1.
Molecular comparison, characterization, and mapping of chCD1 genes and protein sequences. (A) Alignment of the chicken chCD1-2, chCD1-1, human CD1a, human CD1b, mouse CD1d, chBF2*12 (chicken MHCI), human HLA-A2, and mouse H2Kd. Note that chCD1-1 is a hypothetical sequence based on conceptual splicing of genomic DNA. Black boxes, identical or conserved substitutions at all residues at that position; dark gray, 80% conserved; light gray, 60% conserved. Intramolecular disulfide bonds (connected yellow triangles) are indicated. Note that the α2 disulfide bond (connected dashed line) is not present in the human CD1a crystal structure and cannot form in chCD1-2. MHCI peptide anchor residues (*) and residues that interact with β2M (b) are also indicated. A putative dileucine motif (DXXXXLI) at the carboxyl terminus of chCD1-2 protein is highlighted (red), and tyrosine motifs in chCD1-1, human CD1b, and mouse CD1d are in blue. Conserved N-linked NX(S/T) glycosylation site motifs of MHCI and CD1 is indicated by filled green and blue arrows, respectively. Three nucleotide polymorphisms that result in amino acid changes from the red jungle fowl chCD1-2 are indicated in light green above the K24 clone chCD1-2 sequence. (B) PCR of bursa cDNA with primers specific for chCD1-2 (lane 1), chCD1-1 (lane 2), β2M (lane 3), and no template control (lane 4). The red arrow indicates a dominant chCD1-1 product at 900 bp. (C) Schematic diagram showing cloned chCD1-1 cDNA fragments. Sequenced PCR products from B (lane 2) were aligned with the hypothetical full-length chCD1-1 (Lower). Identical residues are in black, and missing DNA from the sequenced clones are indicated in light gray. (D) Calculation of hydrophobicity (NHV) of the α1 helix lining residues of the antigen binding pocket by using known MHCI and CD1 crystal structure data (black bars). The chicken BF2*12 (MHCI) and chCD1-2 protein sequences were modeled on HLA-A2 or human CD1 crystal structures (see Supporting Methods) and the net hydropathy values calculated (gray bars). The modeled protein sequence is listed for each bar with the template crystal structure in parentheses. These data suggest that the putative chCD1-2 antigen binding pocket forms a hydrophobic surface.(E) Map of the G. gallus CD1 locus based on public genome database with minor gaps filled in by this study (dashed lines). The fragment of the chCD1 locus currently mapped to GGA16 in the public database is indicated. PAS, putative polyA sites.
Fig. 2.
Fig. 2.
Relationship of chCD1 proteins to other members of the MHC class I family. A neighbor-joining tree based on the alignment of the α1-3 domains of the MHCI family of protein sequences including classical, nonclassical, and CD1 sequences from multiple vertebrate species. A complete list of the taxa with accession numbers used can be found in Table 5, which is published as supporting information on the PNAS web site. The chCD1 proteins group with the mammalian CD1 in a distinct cluster (shaded region). Bootstrap values are indicated as a percentage of 1,000 iterations. Values <50% are not shown. The scale bar is the number of substitutions per position.
Fig. 3.
Fig. 3.
Southern blot analysis of genomic DNA. (A) Purified genomic DNA from 17 individual Camperos chickens was digested with BglI. Hybridization was carried out with a chCD1-2 cDNA probe. Autoradiography shows two bands of 6.1 kb and 3.6 kb in all 17 birds, suggesting limited polymorphism of this gene in chickens. DNA molecular weight markers are indicated at left. (B) The blot used for A was reprobed with the F10 cDNA that hybridizes with MHC class I (B and Y) genes in chickens. Note the variability in the number and size of hybridizing bands between individual animals as compared with the uniform pattern in A. (C) Genomic DNA isolated from various bird species was digested with BglI and transferred to the same membrane as A and hybridized simultaneously with the chCD1-2 probe. The contrast of the autoradiogram was adjusted slightly to reveal weaker bands in lanes 18-25. No signal was detected in lane 26 (human). (D) Southern analysis of chCD1-2 gene in chickens with two, three, and four copies of GGA16. Equal amounts of genomic DNA from each animal were analyzed. Autoradiography shows increasing intensity of chCD1-2 probe hybridizing bands (♦ and ▾) as the copy number of GGA16 increases. The blot was rehybridized with a probe encoding β-actin cDNA (□). Densitometry of each band was normalized to the diploid (2X) bands for each the autoradiograms and plotted on the graph. Graph symbols are the same as for the autoradiogram. In addition, dashed lines represent the predicted intensities assuming localization of the chCD1-2 (•) on GGA16 and β-actin (▵) on GGA2.
Fig. 4.
Fig. 4.
Tissue expression of chCD1-2. Total RNA isolated from various chicken lymphoid and nonlymphoid tissues was analyzed by Northern blot. (A) Autoradiogram of chCD1-2 cross-hybridizing bands. Strong signals are present in the bursa (lane 5) and spleen (lane 11). Densitometry (Fig. 9) also revealed weak but detectable signals in the thymus and ovary. (B) Ethidium stained total RNA.

Comment in

References

    1. Flajnik, M. F. & Kasahara, M. (2001) Immunity 15, 351-362. - PubMed
    1. Calabi, F. & Milstein, C. (1986) Nature 323, 540-543. - PubMed
    1. Dascher, C. C. & Brenner, M. B. (2003) Trends Immunol. 24, 412-418. - PubMed
    1. Brigl, M. & Brenner, M. B. (2004) Annu. Rev. Immunol. 22, 817-890. - PubMed
    1. Vincent, M. S., Gumperz, J. E. & Brenner, M. B. (2003) Nat. Immunol. Rev. 4, 517-523. - PubMed

Publication types

MeSH terms