Comparative Study
. 2005 Jun 14;102(24):8668-73.
doi: 10.1073/pnas.0409213102. Epub 2005 Jun 6.

Two CD1 genes map to the chicken MHC, indicating that CD1 genes are ancient and likely to have been present in the primordial MHC

Affiliations
Comparative Study

Two CD1 genes map to the chicken MHC, indicating that CD1 genes are ancient and likely to have been present in the primordial MHC

Jan Salomonsen et al. Proc Natl Acad Sci U S A. .

Abstract

CD1 molecules play an important role in the immune system, presenting lipid-containing antigens to T and NKT cells. CD1 genes have long been thought to be as ancient as MHC class I and II genes, based on various arguments, but thus far they have been described only in mammals. Here we describe two CD1 genes in chickens, demonstrating that the CD1 system was present in the last common ancestor of mammals and birds at least 300 million years ago. In phylogenetic analysis, these sequences cluster with CD1 sequences from other species but are not obviously like any particular CD1 isotype. Sequence analysis suggests that the expressed proteins bind hydrophobic molecules and are recycled through intracellular vesicles. RNA expression is strong in lymphoid tissues but weaker to undetectable in some nonlymphoid tissues. Flow cytometry confirms expression from one gene on B cells. Based on Southern blotting and cloning, only two such CD1 genes are detected, located approximately 800 nucleotides apart and in the same transcriptional orientation. The sequence of one gene is nearly identical in six chicken lines. By mapping with a backcross family, this gene could not be separated from the chicken MHC on chromosome 16. Mining the draft chicken genome sequence shows that chicken has only these two CD1 genes located approximately 50 kb from the classical class I genes. The unexpected location of these genes in the chicken MHC suggests the CD1 system was present in the primordial MHC and is thus approximately 600 million years old.


Figures

Fig. 1.
Fig. 1.
Comparison of amino acid sequences deduced from chicken CD1.1 and CD1.2 cDNAs (from CB chicken line, MHC haplotype B12, GenBank accession nos. AY849319 and AY849320), with human CD1 isotypes (CD1a from Swissprot accession no. P06126, CD1b from P29016, CD1c from P29017, CD1d from P15813, and CD1e from P15812). The first block corresponds to the signal sequence; the second to the α1 domain; the third to the α2 domain; the fourth to the α3 domain; and the fifth to the connecting peptide, transmembrane, and cytoplasmic regions. Identities are indicated by dots and gaps by dashes. Numbers to the right of the sequences indicate the sequence number of the last position on that line, followed by percentage of amino acid identities with chicken CD1.2. Intron/exon boundaries in the chicken CD1.2 gene are indicated by a forward slash above the amino acid whose codon is split (all phase 1 except the last one, which is phase 2) and for CD1.1 are at G21, Y86, V180, E275, and R305. Structural features of the protein from the structures of CD1a, -b, and -d (refs. 15-18) are indicated above the sequences as follows: =, β-strand; +, α-helix; A, A′ pocket; C, C′ pocket; F, F′ pocket, T′, tunnel, and c, other putative antigen contact. N-linked glycosylation signals in the extracellular region are underlined, the transmembrane region is overlined, and potential recycling motifs (as described in ref. 25) in the cytoplasmic tail are underlined. The two amino acid positions in CD1.2 that vary between the chicken lines examined are indicated above the sequences: S150T with ACT for threonine in the lines CB (B12) kept in Prague and C-B4 (B4) kept at the Institute for Animal Health, but AGT for serine in lines 61 and 72 (B2), 15I5 (B15), and N (B21); R311H with CGC for arginine in lines CB (B12), 61 and 72 (B2), and N and 0 (B21), but CAC for histidine in lines 15I5 (B15) and WL (B14). The amino acid position with silent nucleotide variation giving rise to the presence or absence of the XhoI site used in the mapping is indicated with an X above the line (CTCGAG in all lines above except for CTGGAG in line 15I5).
Fig. 2.
Fig. 2.
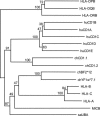
Phylogenetic analysis of the amino acid sequences of chicken CD1.1 and CD1.2. The tree was constructed by using full-length protein sequences, with the neighbor-joining method of the phylip program from the gcg package (Genetics Computing Group, Madison, WI). Numbers indicate bootstrap values from 500 replicates. GenBank accession nos. are as follows: human CD1 isotypes as in Fig. 1 legend; classical class I sequences from human, chicken, and salmon [HLA-A2 (P01892), HLA-B27 (P10317), HLA-C (P10317), BF2*1201 (AL023516), Sasa-UBA (AF504019)]; nonclassical class I sequences from human and chicken [MICB (P79525), YF1w*7.1 (Q9BCW3)]; and classical class II sequences from human [HLA-DRB (P01913), HLA-DQB (P05537), HLA-DPB1 (Q30174)].
Fig. 3.
Fig. 3.
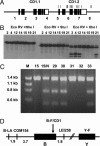
Location of the chicken CD1 genes. (A) Intron/exon structure (from 9.1 kb of sequence from the CB chicken line, MHC haplotype B12, deposited with GenBank accession no. AY849318), including locations of SNPs for CD1.2 by comparisons of sequences from lines C-B4, 61, 72, WL, 15I5, 0, and N. Exons indicated by boxes (closed for coding, open for 3′UTR) for CD1.1: exon 1, 1374 (start protein 1422)-1482; exon 2, 1672-1920; exon 3, 2791-3072; exon 4, 3160-3444; exon 5, 3531-3621; exon 6, 3697 (end protein 3829)-4208; polyadenylation site 4186-4191; CD1.2: exon 1, 5084 (start protein 5090)-5150; exon 2, 5478-5756; exon 3, 6259-6540; exon 4, 6629-6913; exon 5, 6994-7087; exon 6, 7160 (end protein 7202)-7772; and cryptic polyadenylation site 7746-7750 predicted by genebuilder (http://125.itba.mi.cnr.it/~webgene/genebuilder.html). Analysis of the draft chicken genome sequence (www.ensembl.org/chicken) showed that the 3′ end of the sequence (starting at position 6986 and including the last two exons of CD1.2) overlaps the end of contig 638.25, placing CD1.2 to the right of a seven-transmembrane receptor gene (GENESCAN00000040413) but in the opposite orientation (and likely to be in same transcriptional orientation to the major classical class I gene, BF2). SNPs (indicated by vertical lines) from partial sequences starting at position 4608 are T5077C, G5206del, T5851A, A5920G, C5942T, C6287A, C6433G, G6507A, C6531G (used for mapping), C6783T, C6985T, G7083A, T7211A, C8089T, and A8103G. Numbers below the line indicate the nucleotide position in kb. (B) Southern blot of genomic DNA from seven inbred lines of chickens with defined MHC type [lines 61 (B2), C-B4 (B4), C-B12 (B12), WL (B14), 15I5 (B15), P2a (B19), and N (B21)] digested with EcoRV followed by either NheI, StuI, or XhoI, and probed with a 1.3-kb exon 3 through exon 4 of the CD1.2 gene. The probe was produced from 5 ng of genomic B21 genomic DNA in 30 μl of final volume including 20 pmol of each primer [c1124 (CGGTTCATGCATGAGATGAC), c1125 (CAACAGTGGAAGATGCACTG)], 1× enzyme buffer, 0.2 mM total dNTPs, 1.5 mM MgCl2, 2.5 units of proof-reading polymerase Pwo (Hybaid, Middlesex, U.K.) with amplification conditions of 1 min at 96°C, 30 cycles of 30 s at 96°C, 30 s at 55°C, and 1 min at 72°C, and twice purified by agarose gel electrophoresis. Southern blots were performed as described (26, 27), with washing at low stringency (2× SSC at 65°C for 30 min). Lines WL, 15I5, and P2a lack the XhoI site and show only a single major band of ≈1,320 bp, with the other lines showing the CD1.2 gene cut into two bands of ≈815 and 505 bp, leaving behind the band representing CD1.1. (C) Mapping of the CD1.2 gene. Genomic DNA from the two parents [(15I5 × N) F1 hen and 15I5 cockerel] and 55 progeny of the Compton backcross reference family (28) were used for mapping as described (27). For PCR, 5-50 ng of genomic DNA were amplified by using primers c1124 and c1125 and conditions as described in the Fig. 3B legend. The products were separated by an agarose gel, purified from excised bands by using Minelute columns according to the manufacturer's protocol (Qiagen), digested with 10 units of XhoI (Invitrogen) with the supplied buffer at 37°C for 5 h, and visualized with ethidium bromide on an agarose gel. M indicates the DNA markers (sizes of bands on the side); 15 and 15/N indicate DNA from male and female parents, respectively; and numbers indicate DNA from individual chickens in the mapping family. Progeny 31 and 32 have only the 1,320-bp band corresponding to two copies of the B15 allele, whereas progeny 29, 30, and 33 have 815- and 505-bp bands corresponding to one copy of the B21 allele and a 1,320-bp band corresponding to one copy of the B15 CD1 gene allele. Linkage analysis was performed by using map manager (29). A logarithm of odds score (Z) value above three (P = 0.001) in two-point analysis was used as the significant threshold for linkage. Map distances were calculated with the Haldane map function (cM). (D) Current genetic map of chicken chromosome 16, with result of mapping CD1 to the B locus as defined by BG, BF, BLB, and TAP probes, among others. Genetic distances are in cM. As discussed (22), the distances and locus order in this map supersede those found in various web sites and publications.
Fig. 4.
Fig. 4.
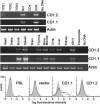
Tissue distribution of CD1. RT-PCR from RNA from (Top) six immunoisolated spleen cell populations and (Middle) 10 tissues, one macrophage line (HD11 cells), and isolated embryonic enterocytes. First-strand cDNA was prepared by incubation of 2 h at 42°C of 4 μl of RNA preparation and 80 units of RNAsin (Promega) in 40 μl of final volume including 1× first-strand buffer, 10 mM DTT, 20 mM total dNTPs, 1 μg oligo(dT), and 400 units of reverse transcriptase Superscript II (Invitrogen). Using primers for CD1.2 (c1124 and c1125, described in the legend to Fig. 3, amplifying 683 bp of cDNA) and β-actin [c765 (CTGGTCGTACCACTGGTATTG), c766 (CAGGTGGCGCAATGATCTTG)], the PCR mixtures were 0.5 μl of cDNA in 50 μl of final volume including 15 pmol each primer, 0.2 mM total dNTPs, 1× enzyme buffer, 1.5 mM MgCl2, and 2.5 units of recombinant Taq polymerase (Invitrogen), with amplification conditions of 2 min at 96°C, 35 cycles of 30 s at 96°C, 30 s at 55°C, and 1 min at 68°C. Using primers for CD1.1 [c1728 (GTGGAGCTGCATCACAGACACCATG), c1729 (CCCAAACCCCACTCACTCCCACACCTC), amplifying 1,553 bp of cDNA], the PCR mixtures were the same but included 5% DMSO with amplification conditions of 2 min at 94°C, then seven cycles of 30 s at 94°C, 2 min at 68°C, followed by 35 cycles of 30 s at 94°C, 30 s at 60°C, and 1 min at 68°C. Flow cytometric analysis (Bottom) of peripheral blood leukocytes from a line C-B12 chicken and COS cells transiently transfected with pcDNA3.1 with no insert, with CD1.1 cDNA or with CD1.2 cDNA stained with TRT1 (IgG1 isotype-matched control, filled gray peak), monoclonal antibody to myc peptide (Sigma, gray line) or monoclonal antibody CB3 (ref. , solid line). Flow cytometric analysis was as described (31), with second antibody polyclonal FITC-conjugated goat anti-mouse Ig (DAKO) using FACSCalibur (Beckman).

Comment in

Similar articles

Cited by

References

    1. Flajnik, M. & Kasahara, M. (2001) Immunity 15, 351-362. - PubMed
    1. Kasahara, M., Suzuki, T. & Du Pasquier, L. (2004) Trends Immunol. 25, 105-111. - PubMed
    1. Eason, D., Cannon, J., Haire, R., Rast, J., Ostrov, D. & Litman, G. (2004) Semin. Immunol. 16, 215-226. - PubMed
    1. Porcelli, S. & Modlin, R. (1999) Annu. Rev. Immunol. 17, 297-329. - PubMed
    1. Jayawardena-Wolf, J. & Bendelac, A. (2001) Curr. Opin. Immunol. 13, 109-113. - PubMed

Publication types

Associated data