

Effect of electro-acupuncture on ovarian expression of alpha (1)- and beta (2)-adrenoceptors, and p75 neurotrophin receptors in rats with steroid-induced polycystic ovaries
- PMID: 15941472
- PMCID: PMC1175857
- DOI: 10.1186/1477-7827-3-21
Effect of electro-acupuncture on ovarian expression of alpha (1)- and beta (2)-adrenoceptors, and p75 neurotrophin receptors in rats with steroid-induced polycystic ovaries
Abstract
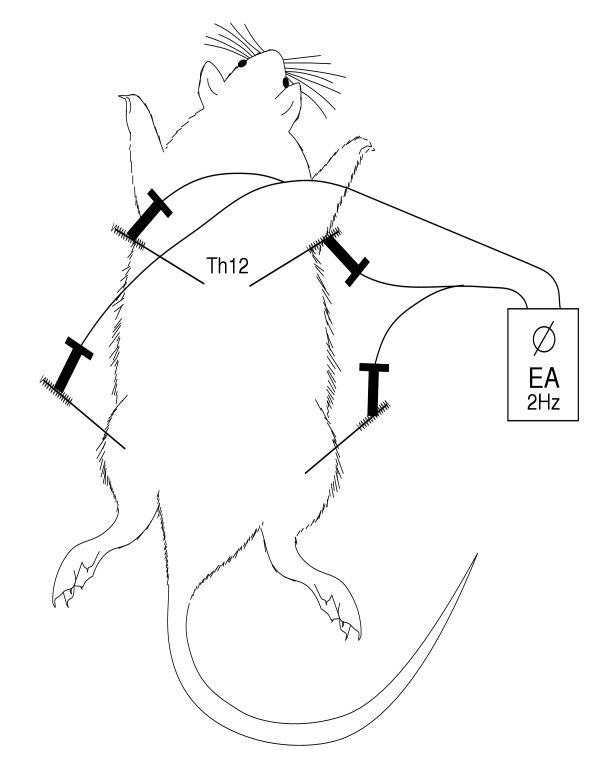
Background: Estradiol valerate (EV)-induced polycystic ovaries (PCO) in rats is associated with an increase in ovarian sympathetic outflow. Low-frequency (2 Hz) electro-acupuncture (EA) has been shown to modulate sympathetic markers as well as ovarian blood flow as a reflex response via the ovarian sympathetic nerves, in rats with EV-induced PCO.
Methods: In the present study, we further tested the hypothesis that repeated 2 Hz EA treatments modulate ovarian sympathetic outflow in rats with PCO, induced by a single i.m. injection of EV, by investigating the mRNA expression, the amount and distribution of proteins of alpha1a-, alpha1b-, alpha1d-, and beta2-adrenoceptors (ARs), as well as the low-affinity neurotrophin receptor (p75NTR).
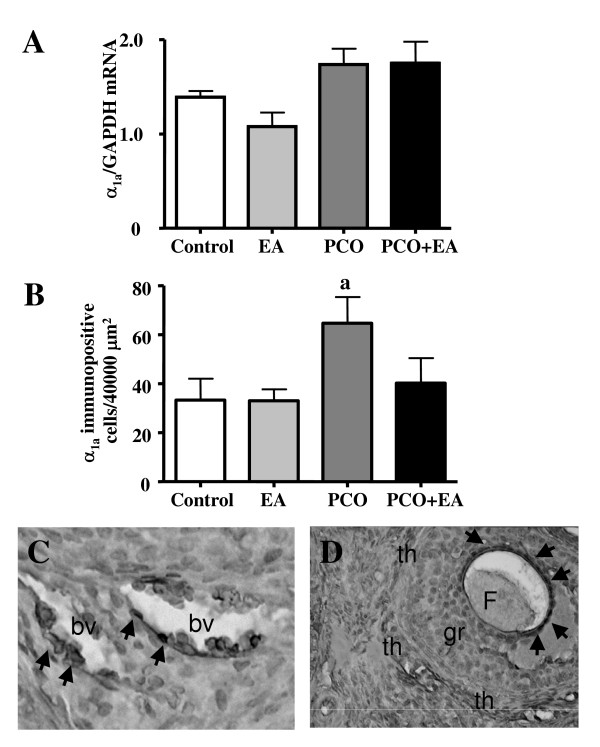
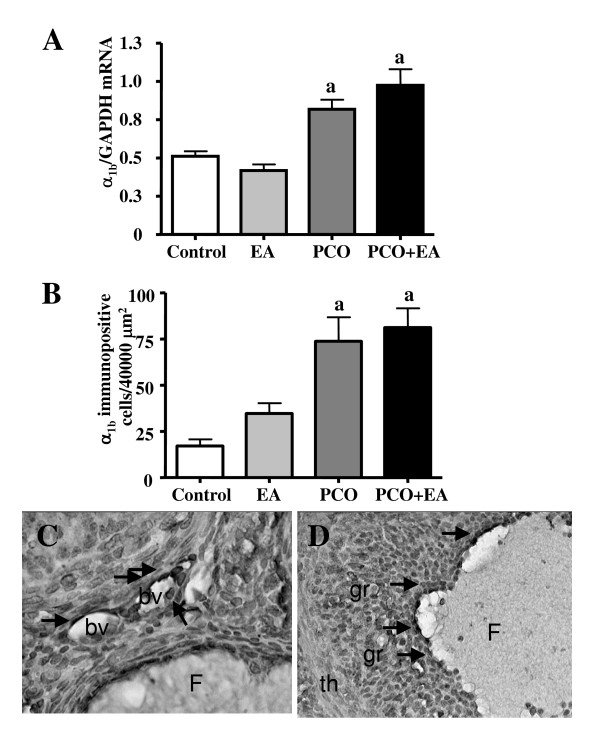
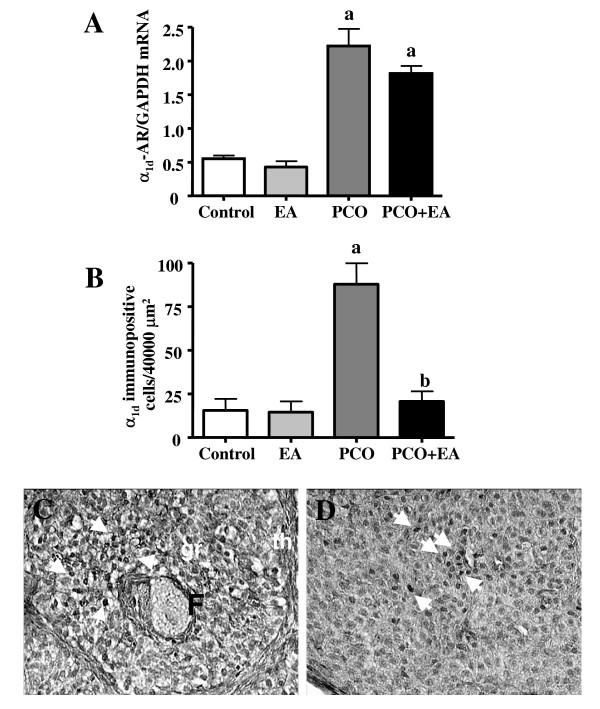
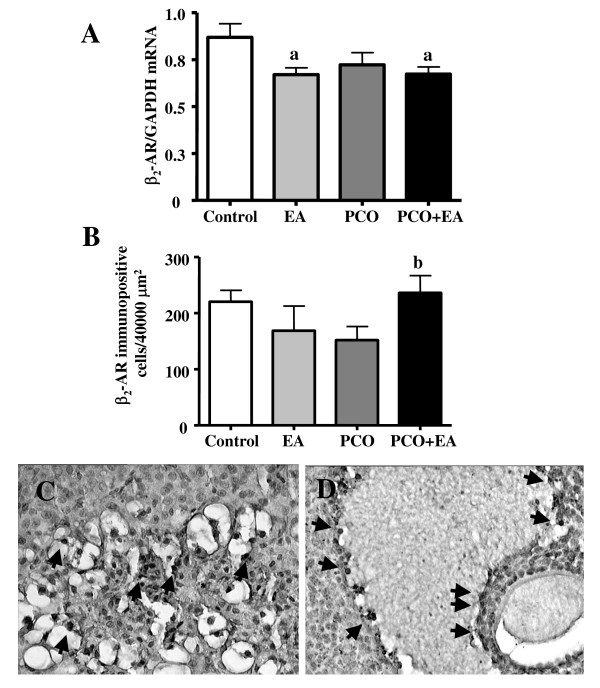
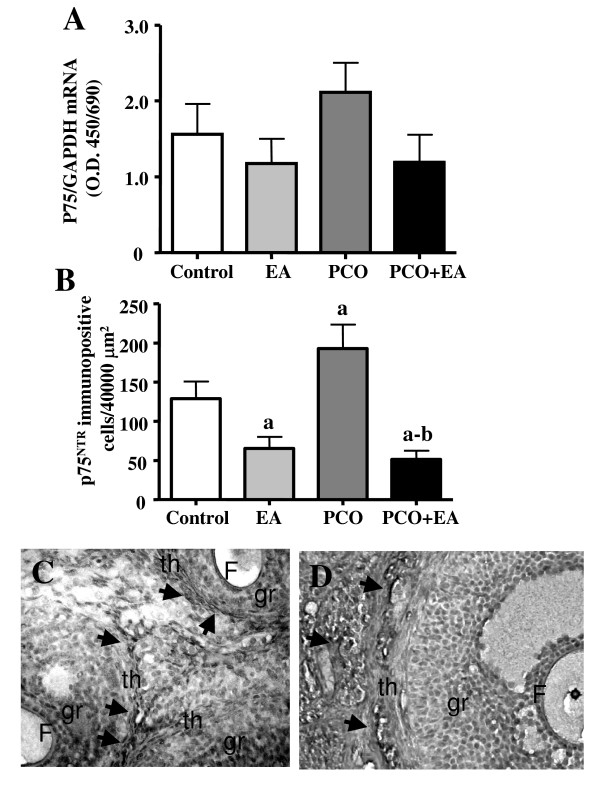
Results: It was found that EV injection results in significantly higher mRNA expression of ovarian alpha1b- and alpha1d-AR in PCO rats compared to control rats. The p75NTR and beta2-ARs mRNA expression were unchanged in the PCO ovary. Low-frequency EA resulted in a significantly lower expression of beta2-ARs mRNA expression in PCO rats. The p75NTR mRNA was unaffected in both PCO and control rats. PCO ovaries displayed significantly higher amount of protein of alpha1a-, alpha1b- and alpha1d-ARs, and of p75NTR, compared to control rats, that were all counteracted by repeated low-frequency EA treatments, except for alpha1b-AR.
Conclusion: The present study shows that EA normalizes most of the EV-induced changes in ovarian ARs. Furthermore, EA was able to prevent the EV-induced up regulation of p75NTR, probably by normalizing the sympathetic ovarian response to NGF action. Our data indicate a possible role of EA in the regulation of ovarian responsiveness to sympathetic inputs and depict a possible complementary therapeutic approach to overcoming sympathetic-related anovulation in women with PCOS.
Figures
Similar articles
-
Ovarian expression of alpha (1)- and beta (2)-adrenoceptors and p75 neurotrophin receptors in rats with steroid-induced polycystic ovaries.Auton Neurosci. 2005 Mar 31;118(1-2):79-87. doi: 10.1016/j.autneu.2005.01.004. Auton Neurosci. 2005. PMID: 15795180
-
Effect of exercise on ovarian morphology and expression of nerve growth factor and alpha(1)- and beta(2)-adrenergic receptors in rats with steroid-induced polycystic ovaries.J Neuroendocrinol. 2005 Dec;17(12):846-58. doi: 10.1111/j.1365-2826.2005.01378.x. J Neuroendocrinol. 2005. PMID: 16280032
-
Effect of anti-NGF on ovarian expression of alpha1- and beta2-adrenoceptors, TrkA, p75NTR, and tyrosine hydroxylase in rats with steroid-induced polycystic ovaries.Am J Physiol Regul Integr Comp Physiol. 2006 Mar;290(3):R826-35. doi: 10.1152/ajpregu.00078.2005. Epub 2005 Sep 29. Am J Physiol Regul Integr Comp Physiol. 2006. PMID: 16195501
-
The sympathetic nervous system in polycystic ovary syndrome: a novel therapeutic target?Clin Endocrinol (Oxf). 2012 Dec;77(6):791-801. doi: 10.1111/cen.12003. Clin Endocrinol (Oxf). 2012. PMID: 22882204 Review.
-
[Ovarian denervation and polycystic ovary].Ginecol Obstet Mex. 2005 Feb;73(2):90-8. Ginecol Obstet Mex. 2005. PMID: 21961343 Review. Spanish.
Cited by
-
Acupuncture for "poor ovarian response" of women to controlled ovarian hyperstimulation: A protocol for meta-analysis and systematic review.Medicine (Baltimore). 2020 Oct 30;99(44):e22868. doi: 10.1097/MD.0000000000022868. Medicine (Baltimore). 2020. PMID: 33126333 Free PMC article.
-
Hypothalamic neuroendocrine functions in rats with dihydrotestosterone-induced polycystic ovary syndrome: effects of low-frequency electro-acupuncture.PLoS One. 2009 Aug 14;4(8):e6638. doi: 10.1371/journal.pone.0006638. PLoS One. 2009. PMID: 19680559 Free PMC article.
-
Acupuncture and women's health: an overview of the role of acupuncture and its clinical management in women's reproductive health.Int J Womens Health. 2014 Mar 17;6:313-25. doi: 10.2147/IJWH.S38969. eCollection 2014. Int J Womens Health. 2014. PMID: 24669195 Free PMC article. Review.
-
Ovarian Innervation Coupling With Vascularity: The Role of Electro-Acupuncture in Follicular Maturation in a Rat Model of Polycystic Ovary Syndrome.Front Physiol. 2020 May 29;11:474. doi: 10.3389/fphys.2020.00474. eCollection 2020. Front Physiol. 2020. PMID: 32547407 Free PMC article.
-
Electro-Acupuncture Affects the Activity of the Hypothalamic-Pituitary-Ovary Axis in Female Rats.Front Physiol. 2019 Apr 24;10:466. doi: 10.3389/fphys.2019.00466. eCollection 2019. Front Physiol. 2019. PMID: 31068836 Free PMC article.
References
-
- Lobo RA. The role of neurotransmitters and opioids in polycystic ovarian syndrome. Endocrinol Metab Clin North Am. 1988;17:667–683. - PubMed
-
- Lobo RA, Granger LR, Paul WL, Goebelsmann U, Mishell DRJ. Psychological stress and increases in urinary norepinephrine metabolites, platelet serotonin, and adrenal androgens in women with polycystic ovary syndrome. Am J Obstet Gynecol. 1983;145:496–503. - PubMed
-
- Semenova II. Adrenergic innervation of the ovaries in Stein-Leventhal syndrome. Vestn Akad Med Nauk SSSR (Abstract in english) 1969;24:58–62. - PubMed
Publication types
MeSH terms
Substances
LinkOut - more resources
Full Text Sources
Medical
Research Materials
