Comparative Study
. 2005 Jun 8:6:144.
doi: 10.1186/1471-2105-6-144.

PAGE: parametric analysis of gene set enrichment

Affiliations
Comparative Study

PAGE: parametric analysis of gene set enrichment

Seon-Young Kim et al. BMC Bioinformatics. .

Abstract

Background: Gene set enrichment analysis (GSEA) is a microarray data analysis method that uses predefined gene sets and ranks of genes to identify significant biological changes in microarray data sets. GSEA is especially useful when gene expression changes in a given microarray data set is minimal or moderate.

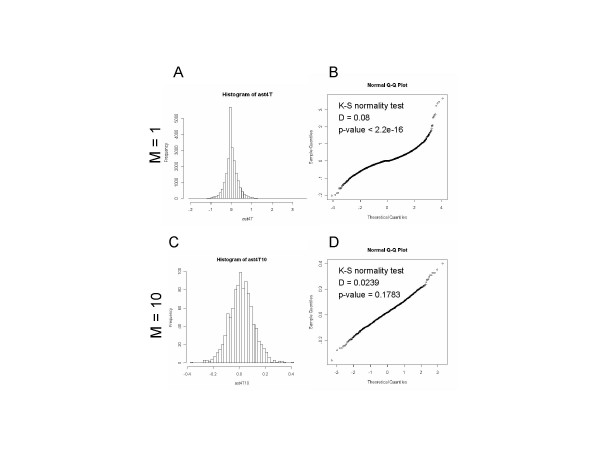
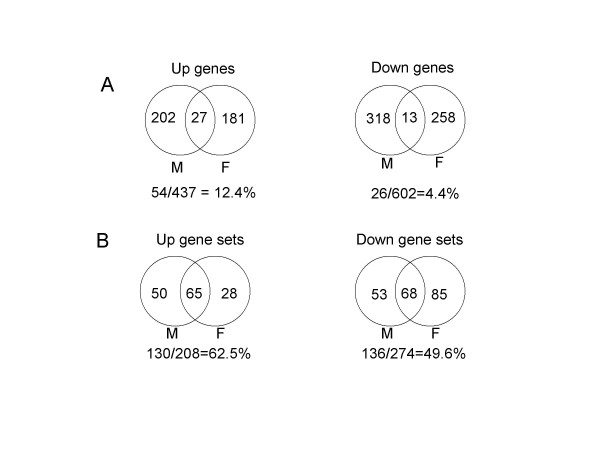
Results: We developed a modified gene set enrichment analysis method based on a parametric statistical analysis model. Compared with GSEA, the parametric analysis of gene set enrichment (PAGE) detected a larger number of significantly altered gene sets and their p-values were lower than the corresponding p-values calculated by GSEA. Because PAGE uses normal distribution for statistical inference, it requires less computation than GSEA, which needs repeated computation of the permutated data set. PAGE was able to detect significantly changed gene sets from microarray data irrespective of different Affymetrix probe level analysis methods or different microarray platforms. Comparison of two aged muscle microarray data sets at gene set level using PAGE revealed common biological themes better than comparison at individual gene level.

Conclusion: PAGE was statistically more sensitive and required much less computational effort than GSEA, it could identify significantly changed biological themes from microarray data irrespective of analysis methods or microarray platforms, and it was useful in comparison of multiple microarray data sets. We offer PAGE as a useful microarray analysis method.


Figures

Figure 1
Figure 1
Distribution pattern of fold change values in a microarray data and determination of minimal gene set size in PAGE. A and B. A Histogram (A) and a quantile-quantile (Q-Q) plot against standard normal distribution (B) of fold change values from microarray data set. The diabetic muscle microarray data set [25] was analyzed as described in Methods section. The fold change values between normal and patient groups were calculated and used to draw histogram (A) and Q-Q plot (B). C and D. A Histrogram (C) and a Q-Q plot (D) of an average of 10 randomly sampled values from fold change values of diabetic muscle microarray data. Kolmogorov-Smirnov normality test was performed with a null hypothesis that distribution is normal. For the distribution of fold change values (A and B), the null hypothesis was rejected (D = 0.08, p-value < 2.2e-16). For the distribution of an average of 10 randomly sampled values from fold change values (C and D), the null hypothesis was not rejected (D = 0.0239, p-value = 0.1783).
Figure 2
Figure 2
Comparison of different microarray data sets at gene set level shows better congruence than comparison at gene level. A. Comparison of two different microarray data sets at gene level. Two microarray data sets, GDS 287 (Muscle function and aging-Male) and GDS 472 (Muscle function and aging-Female) were analyzed, significantly changed genes (|fold change| > 1.5 and t-test p < 0.05) from each data set were selected, and the percentage of common gene lists for both data sets was calculated. B. Comparison at gene set level. We first performed PAGE on the two microarray data sets, selected significant gene sets (p < 0.05), and calculated percentage of common gene sets for both data sets.

Similar articles

Cited by

References

    1. Churchill GA. Fundamentals of experimental design for cDNA microarrays. Nat Genet. 2002;32:490–495. doi: 10.1038/ng1031. - DOI - PubMed
    1. Rhodes DR, Chinnaiyan AM. Bioinformatics strategies for translating genome-wide expression analyses into clinically useful cancer markers. Ann NY Acad Sci. 2004;1020:32–40. doi: 10.1196/annals.1310.005. - DOI - PubMed
    1. Li C, Wong WH. Model-based analysis of oligonucleotide arrays: expression index computation and outlier detection. Proc Natl Acad Sci USA. 2001;98:31–36. doi: 10.1073/pnas.011404098. - DOI - PMC - PubMed
    1. Irizarry RA, Bolstad BM, Collin F, Cope LM, Hobbs B, Speed TP. Summaries of Affymetrix GeneChip probe level data. Nucleic Acids Res. 2003;31:e15. doi: 10.1093/nar/gng015. - DOI - PMC - PubMed
    1. Quackenbush J. Microarray data normalization and transformation. Nat Genet. 2002;32:496–501. doi: 10.1038/ng1032. - DOI - PubMed

Publication types

MeSH terms

LinkOut - more resources