Comparative Study
. 2005 Jun 14;102(24):8603-8.
doi: 10.1073/pnas.0503072102. Epub 2005 Jun 7.

Global and Hox-specific roles for the MLL1 methyltransferase

Affiliations
Comparative Study

Global and Hox-specific roles for the MLL1 methyltransferase

Matthew G Guenther et al. Proc Natl Acad Sci U S A. .

Abstract

The mixed-lineage leukemia (MLL1/ALL-1/HRX) histone methyltransferase is involved in the epigenetic maintenance of transcriptional memory and the pathogenesis of human leukemias. To understand its role in cell type specification, we determined the human genomic binding sites of MLL1. We found that MLL1 functions as a human equivalent of yeast Set1. Like Set1, MLL1 localizes with RNA polymerase II (Pol II) to the 5' end of actively transcribed genes, where histone H3 lysine 4 trimethylation occurs. Consistent with this global role in transcription, MLL1 also localizes to microRNA (miRNA) loci that are involved in leukemia and hematopoiesis. In contrast to the 5' proximal binding behavior at most protein-coding genes, MLL1 occupies an extensive domain within a transcriptionally active region of the HoxA cluster. The ability of MLL1 to serve as a start site-specific global transcriptional regulator and to participate in larger chromatin domains at the Hox genes reveals dual roles for MLL1 in maintenance of cellular identity.


Figures

Fig. 1.
Fig. 1.
Identification of MLL1 and Pol II bound regions. (a–c) Single-array intensities of DNA fragments obtained from MLL1 (a), Pol II (b), and IgG control (c) ChIPs plotted against whole-cell extract (WCE) control intensities. Red lines represent confidence thresholds of 0.001, and red dots represent intergenic control regions. (d) Representation of cooccupancy of MLL1 with all Pol II-bound elements in U937 cells. The total number of Pol II-occupied elements is 5,428.
Fig. 2.
Fig. 2.
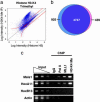
Genomic location of H3-K4 trimethylation. (a) Single-array intensities of DNA fragments enriched by ChIP using anti-H3-K4 trimethylation antibody in U937 cells versus anti-histone H3 immunoprecipitate. Red lines represent confidence thresholds of 0.001, and red dots represent intergenic control regions. (b) Venn diagram showing overlap between genomic regions bound by MLL1 (pink circle) and H3-K4 trimethylation (blue circle). (c) ChIP analysis showing the occupancy of Pol II, MLL1, and H3-K4 trimethylation at the Meis1 (base pairs +1to +250), HoxA11 (base pairs +1to +250), HoxB13 (base pairs +1 to +250), and actin (base pairs -750 to -500) promoter regions in U937 cells. PCR products shown are resolved on 2.0% agarose support, and three dilutions (90, 30, and 10 ng) of total input are shown on the left.
Fig. 3.
Fig. 3.
Binding behavior of MLL1, Pol II, and H3-K4 trimethylation. (a) Schematic representation of probe sequences used for each of the 276 profiled genes. Overlapping probes in relation to the transcription start site are as follows: 1, -3,775 to -2,625; 2, -2,775 to -1,625; 3, -1,775 to -625; 4, -775 to +375; 5, +225 to +1,375; and 6, +1,225 to +2,375 bp. (b) Percentage of total probes enriched by MLL1 (red circles), Pol II (blue squares), and H3-K4 trimethylation (green triangles). Binding data are cumulative for all 276 genes.
Fig. 4.
Fig. 4.
Correlation of MLL1 binding and gene transcription. (Left) Enriched promoter regions obtained from genome-wide location analysis of MLL1, Pol II, and H3-K4 trimethyl in U937 cells are aligned for each individual gene. Blue dashes indicate a positive binding event at P < 0.001. (Right) RNA transcript levels of human tissues and cell lines from the Novartis v2 expression data set were clustered by using average-linkage hierarchical clustering. Red indicates relative overexpression, and green dashes indicate relative underexpression.
Fig. 5.
Fig. 5.
Hox-specific binding profile of MLL1. (a) Schematic representation of the 130 Kb HoxA cluster region on chromosome 7p15.2. Binding events at P < 0.001 for MLL1 (blue rectangle) and H3-K4 trimethylation (red rectangle) are shown for each individual Hox gene probe. (b) Average fold enrichment of all tiled HoxA genes (HoxA1-HoxA13). Overlapping probes in relation to the transcription start site are as follows: 1, -3,775 to -2,625; 2, -2,775 to -1,625; 3, -1,775 to -625; 4, -775 to +375; 5, +225 to +1,375; and 6, +1,225 to +2,375. (c) Average fold enrichment of all tiled E2F genes (E2F1–E2F6). Overlapping probes in relation to the transcription start site are as follows: 1, -3,775 to -2,625; 2, -2,775 to -1,625; 3, -1,775 to -625; 4, -775 to +375; 5, +225 to +1,375; and 6, +1,225 to +2,375. (d) Schematic model of HoxA domain formation. MLL1 complex (blue) and H3-K4 trimethylation (red) form a region of activation within the late HoxA cluster.

References

    1. Fischle, W., Wang, Y. & Allis, C. D. (2003) Curr. Opin. Cell Biol. 15, 172-183. - PubMed
    1. Sims, R. J., III, Nishioka, K. & Reinberg, D. (2003) Trends Genet. 19, 629-639. - PubMed
    1. Bernstein, B. E., Humphrey, E. L., Erlich, R. L., Schneider, R., Bouman, P., Liu, J. S., Kouzarides, T. & Schreiber, S. L. (2002) Proc. Natl. Acad. Sci. USA 99, 8695-8700. - PMC - PubMed
    1. Santos-Rosa, H., Schneider, R., Bannister, A. J., Sherriff, J., Bernstein, B. E., Emre, N. C., Schreiber, S. L., Mellor, J. & Kouzarides, T. (2002) Nature 419, 407-411. - PubMed
    1. Ng, H. H., Robert, F., Young, R. A. & Struhl, K. (2003) Mol. Cell 11, 709-719. - PubMed

Publication types

MeSH terms